| Red | Green | Blue | |
| z | 17.64 | ||
| znorm | Inf | ||
| sky | -Inf | -Inf | -Inf |
| S/N | 30.4 | 49.9 | 56.1 |
| S/N(c) | 0.0 | 0.0 | 0.0 |
| SN(E/C) |
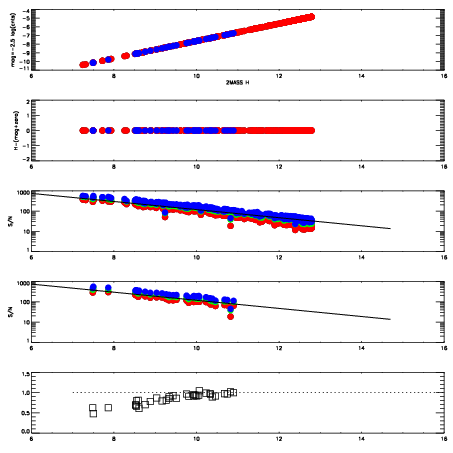
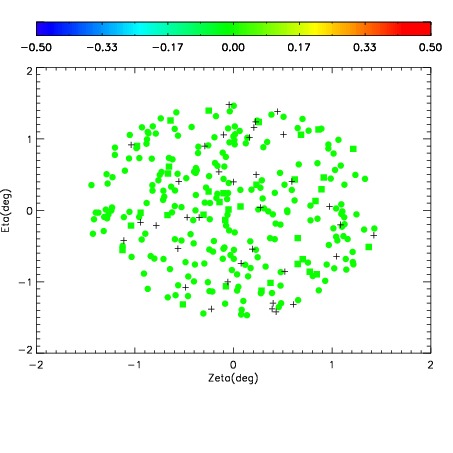
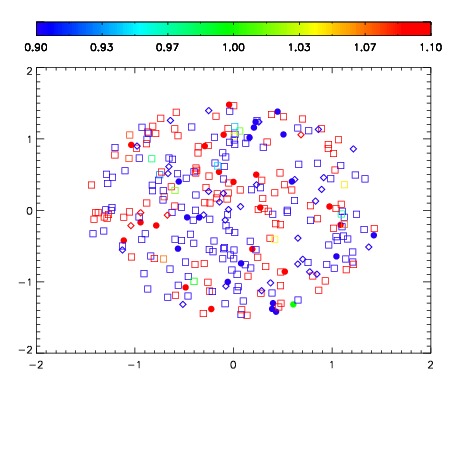
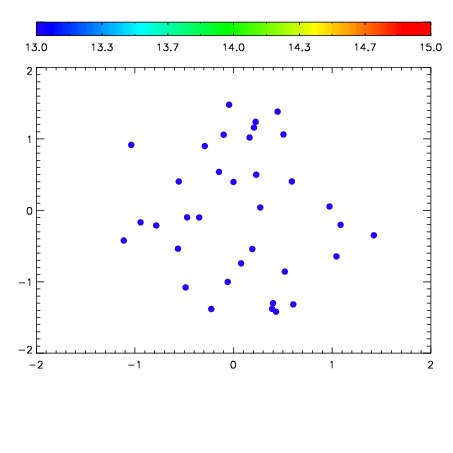

| Frame | Nreads | Zeropoints | Mag plots | Spatial mag deviation | Spatial sky 16325A emission deviations (filled: sky, open: star) | Spatial sky continuum emission | Spatial sky telluric CO2 absorption deviations (filled: H < 10) | |||||||||||||||||||||||
| 0 | 0 |
|
|
|
|
|
|
| IPAIR | NAME | SHIFT | NEWSHIFT | S/N | NAME | SHIFT | NEWSHIFT | S/N |
| 0 | 17300035 | 0.504024 | 0.00000 | 19.1907 | 17300037 | 0.00286508 | 0.501159 | 19.1813 |
| 1 | 17300034 | 0.503583 | 0.000441015 | 19.1229 | 17300036 | 0.00279646 | 0.501228 | 19.1760 |
| 2 | 17300038 | 0.503968 | 5.60284e-05 | 19.1211 | 17300033 | 0.00000 | 0.504024 | 19.1504 |
| 3 | 17300039 | 0.503963 | 6.10352e-05 | 19.0527 | 17300040 | 0.00308809 | 0.500936 | 18.9713 |