| Red | Green | Blue | |
| z | 17.64 | ||
| znorm | Inf | ||
| sky | -Inf | -Inf | -Inf |
| S/N | 27.0 | 44.2 | 49.7 |
| S/N(c) | 0.0 | 0.0 | 0.0 |
| SN(E/C) |
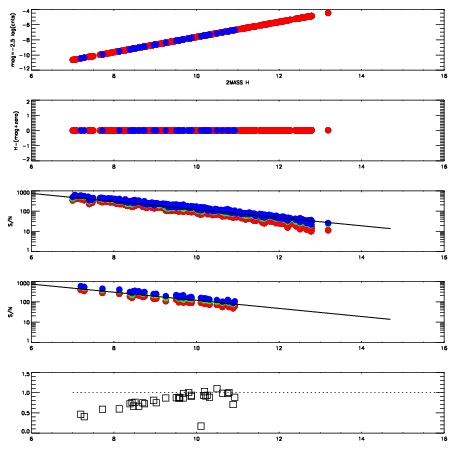
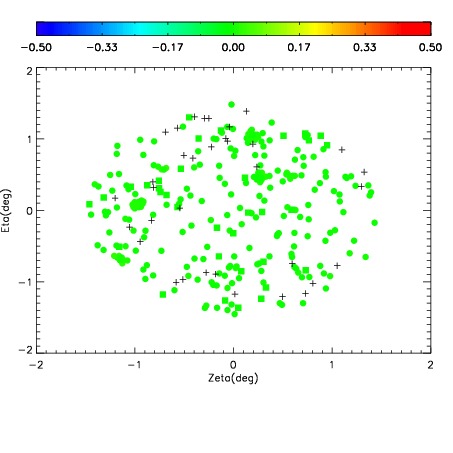
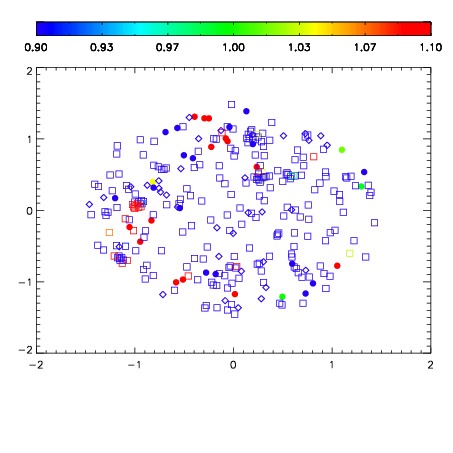
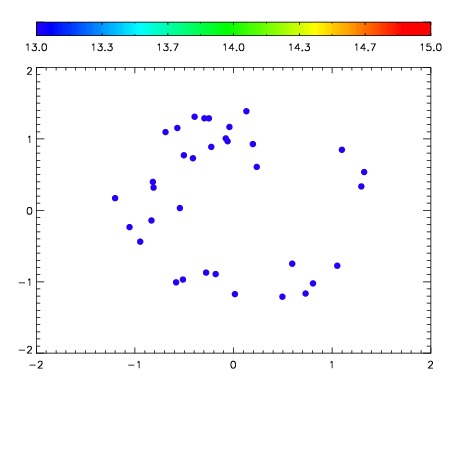

| Frame | Nreads | Zeropoints | Mag plots | Spatial mag deviation | Spatial sky 16325A emission deviations (filled: sky, open: star) | Spatial sky continuum emission | Spatial sky telluric CO2 absorption deviations (filled: H < 10) | |||||||||||||||||||||||
| 0 | 0 |
|
|
|
|
|
|
| IPAIR | NAME | SHIFT | NEWSHIFT | S/N | NAME | SHIFT | NEWSHIFT | S/N |
| 0 | 13490030 | 0.496989 | 0.00000 | 18.3539 | 13490031 | -0.000214346 | 0.497203 | 18.4779 |
| 1 | 13490026 | 0.496859 | 0.000129998 | 19.2279 | 13490027 | -0.000832599 | 0.497822 | 19.2236 |
| 2 | 13490025 | 0.496837 | 0.000152022 | 19.1933 | 13490024 | 0.00000 | 0.496989 | 19.0943 |
| 3 | 13490029 | 0.495490 | 0.00149900 | 19.1775 | 13490028 | -0.00102939 | 0.498018 | 18.7596 |