| Red | Green | Blue | |
| z | 17.64 | ||
| znorm | Inf | ||
| sky | -Inf | -Inf | -Inf |
| S/N | 34.1 | 56.7 | 60.7 |
| S/N(c) | 0.0 | 0.0 | 0.0 |
| SN(E/C) |
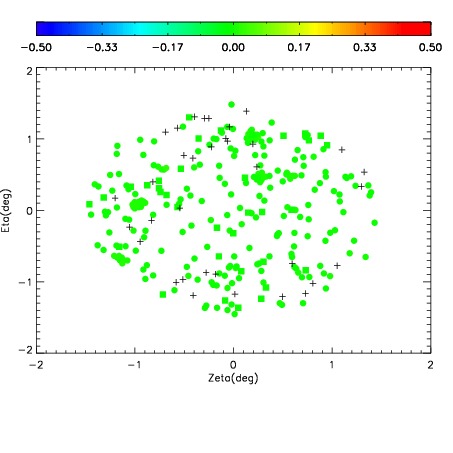
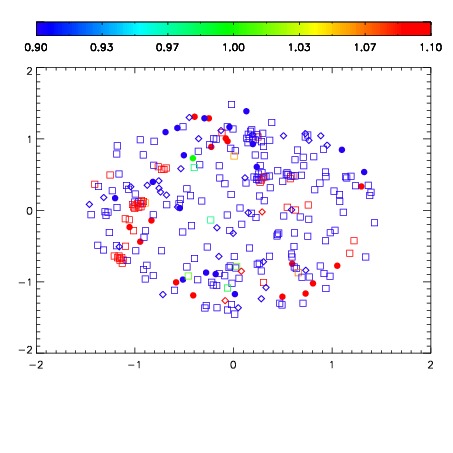
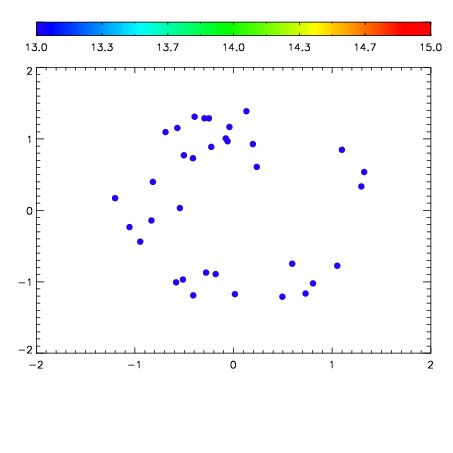

| Frame | Nreads | Zeropoints | Mag plots | Spatial mag deviation | Spatial sky 16325A emission deviations (filled: sky, open: star) | Spatial sky continuum emission | Spatial sky telluric CO2 absorption deviations (filled: H < 10) | |||||||||||||||||||||||
| 0 | 0 |
|
|
|
|
|
|
| IPAIR | NAME | SHIFT | NEWSHIFT | S/N | NAME | SHIFT | NEWSHIFT | S/N |
| 0 | 13720067 | 0.498172 | 0.00000 | 19.0975 | 13720065 | -0.000513967 | 0.498686 | 19.0763 |
| 1 | 13720063 | 0.496666 | 0.00150597 | 19.1455 | 13720061 | 0.00000 | 0.498172 | 19.1483 |
| 2 | 13720062 | 0.495348 | 0.00282398 | 19.1200 | 13720064 | -0.000954476 | 0.499126 | 19.1060 |
| 3 | 13720066 | 0.497946 | 0.000225991 | 19.1031 | 13720068 | -0.000936080 | 0.499108 | 19.0824 |
| 4 | 13720070 | 0.496283 | 0.00188899 | 19.0065 | 13720072 | -0.000411937 | 0.498584 | 18.9362 |
| 5 | 13720071 | 0.497470 | 0.000701994 | 18.9491 | 13720069 | -0.000770522 | 0.498942 | 18.8911 |