| Red | Green | Blue | |
| z | 17.64 | ||
| znorm | Inf | ||
| sky | -Inf | -Inf | -NaN |
| S/N | 28.0 | 47.1 | 50.5 |
| S/N(c) | 0.0 | 0.0 | 0.0 |
| SN(E/C) |
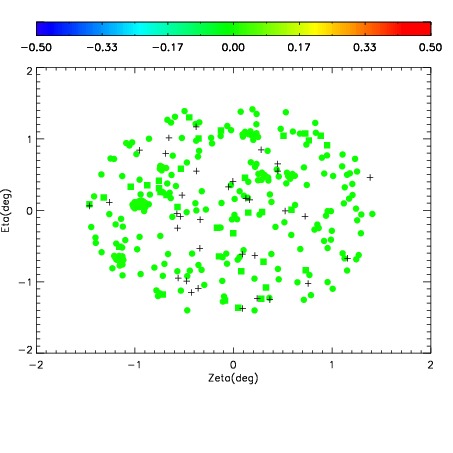
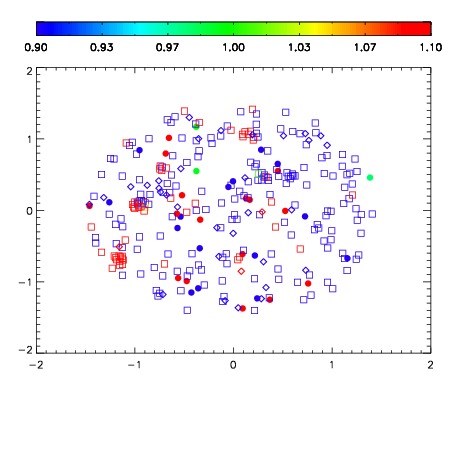


| Frame | Nreads | Zeropoints | Mag plots | Spatial mag deviation | Spatial sky 16325A emission deviations (filled: sky, open: star) | Spatial sky continuum emission | Spatial sky telluric CO2 absorption deviations (filled: H < 10) | |||||||||||||||||||||||
| 0 | 0 |
|
|
|
|
|
|
| IPAIR | NAME | SHIFT | NEWSHIFT | S/N | NAME | SHIFT | NEWSHIFT | S/N |
| 0 | 13730064 | 0.500140 | 0.00000 | 19.1555 | 13730065 | -0.00289223 | 0.503032 | 19.1324 |
| 1 | 13730063 | 0.499240 | 0.000900000 | 19.1387 | 13730062 | -0.00231671 | 0.502457 | 19.1140 |
| 2 | 13730060 | 0.499970 | 0.000170022 | 19.0866 | 13730058 | 0.00000 | 0.500140 | 19.0669 |
| 3 | 13730059 | 0.499614 | 0.000526011 | 19.0591 | 13730061 | -0.00200292 | 0.502143 | 19.0298 |