| Red | Green | Blue | |
| z | 17.64 | ||
| znorm | Inf | ||
| sky | -Inf | -Inf | -Inf |
| S/N | 17.9 | 30.7 | 33.5 |
| S/N(c) | 0.0 | 0.0 | 0.0 |
| SN(E/C) |
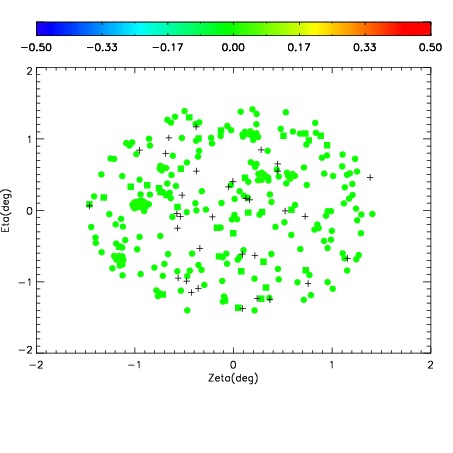
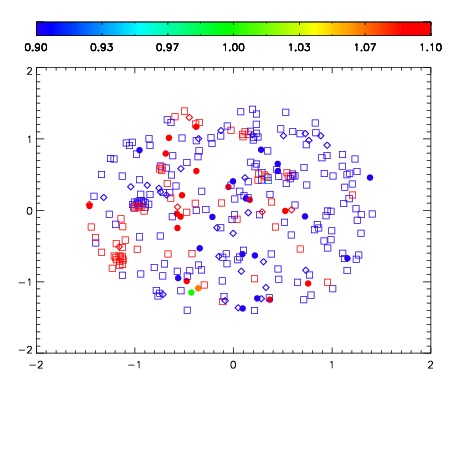


| Frame | Nreads | Zeropoints | Mag plots | Spatial mag deviation | Spatial sky 16325A emission deviations (filled: sky, open: star) | Spatial sky continuum emission | Spatial sky telluric CO2 absorption deviations (filled: H < 10) | |||||||||||||||||||||||
| 0 | 0 |
|
|
|
|
|
|
| IPAIR | NAME | SHIFT | NEWSHIFT | S/N | NAME | SHIFT | NEWSHIFT | S/N |
| 0 | 13760057 | 0.505055 | 0.00000 | 18.3346 | 13760058 | -0.000544558 | 0.505600 | 18.2744 |
| 1 | 13760060 | 0.502389 | 0.00266600 | 19.0698 | 13760055 | 0.00000 | 0.505055 | 18.7563 |
| 2 | 13760061 | 0.501991 | 0.00306404 | 18.7406 | 13760059 | -0.000453710 | 0.505509 | 18.6833 |
| 3 | 13760056 | 0.504625 | 0.000429988 | 18.2571 | 13760062 | -0.00111153 | 0.506167 | 17.9845 |