| Red | Green | Blue | |
| z | 17.64 | ||
| znorm | Inf | ||
| sky | -Inf | -Inf | -NaN |
| S/N | 27.2 | 46.4 | 49.2 |
| S/N(c) | 0.0 | 0.0 | 0.0 |
| SN(E/C) |
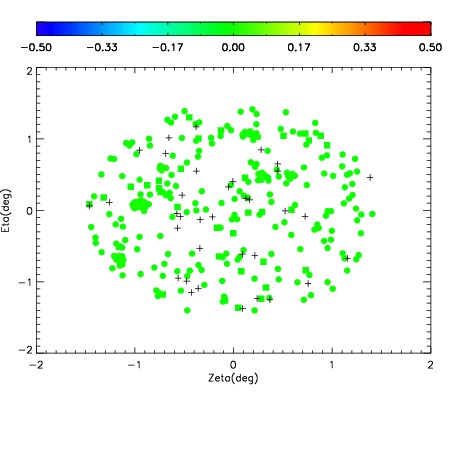


| Frame | Nreads | Zeropoints | Mag plots | Spatial mag deviation | Spatial sky 16325A emission deviations (filled: sky, open: star) | Spatial sky continuum emission | Spatial sky telluric CO2 absorption deviations (filled: H < 10) | |||||||||||||||||||||||
| 0 | 0 |
|
|
|
|
|
|
| IPAIR | NAME | SHIFT | NEWSHIFT | S/N | NAME | SHIFT | NEWSHIFT | S/N |
| 0 | 14060051 | 0.496438 | 0.00000 | 19.1069 | 14060052 | -0.000137108 | 0.496575 | 19.1837 |
| 1 | 14060050 | 0.495817 | 0.000620991 | 19.0900 | 14060053 | -0.000158246 | 0.496596 | 19.0577 |
| 2 | 14060055 | 0.495756 | 0.000681996 | 19.0640 | 14060049 | 0.00000 | 0.496438 | 19.0096 |
| 3 | 14060054 | 0.495006 | 0.00143200 | 18.9419 | 14060056 | 0.000224260 | 0.496214 | 18.9150 |