| Red | Green | Blue | |
| z | 17.64 | ||
| znorm | Inf | ||
| sky | -Inf | -Inf | -NaN |
| S/N | 31.2 | 52.7 | 56.3 |
| S/N(c) | 0.0 | 0.0 | 0.0 |
| SN(E/C) |
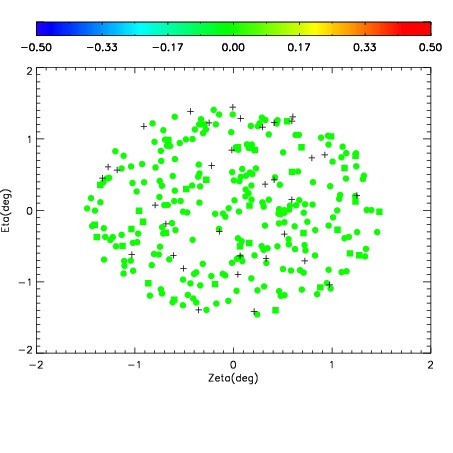
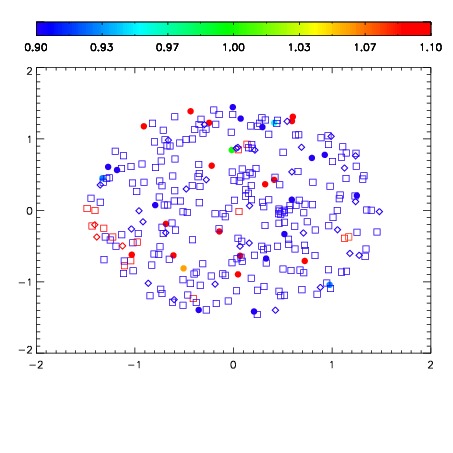
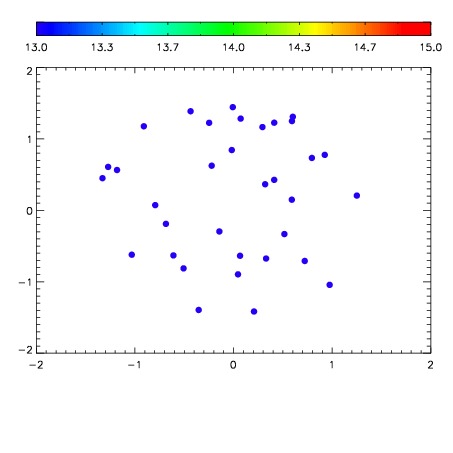

| Frame | Nreads | Zeropoints | Mag plots | Spatial mag deviation | Spatial sky 16325A emission deviations (filled: sky, open: star) | Spatial sky continuum emission | Spatial sky telluric CO2 absorption deviations (filled: H < 10) | |||||||||||||||||||||||
| 0 | 0 |
|
|
|
|
|
|
| IPAIR | NAME | SHIFT | NEWSHIFT | S/N | NAME | SHIFT | NEWSHIFT | S/N |
| 0 | 14280046 | 0.495664 | 0.00000 | 19.2165 | 14280044 | 0.00000 | 0.495664 | 19.2214 |
| 1 | 14280049 | 0.490986 | 0.00467801 | 19.2281 | 14280048 | -0.00118875 | 0.496853 | 19.2375 |
| 2 | 14280045 | 0.495113 | 0.000551015 | 19.2216 | 14280047 | -0.000534035 | 0.496198 | 19.2369 |
| 3 | 14280050 | 0.491692 | 0.00397199 | 19.1971 | 14280051 | -0.00173268 | 0.497397 | 19.1637 |