| Red | Green | Blue | |
| z | 17.64 | ||
| znorm | Inf | ||
| sky | -Inf | -Inf | -NaN |
| S/N | 29.9 | 51.5 | 55.9 |
| S/N(c) | 0.0 | 0.0 | 0.0 |
| SN(E/C) |
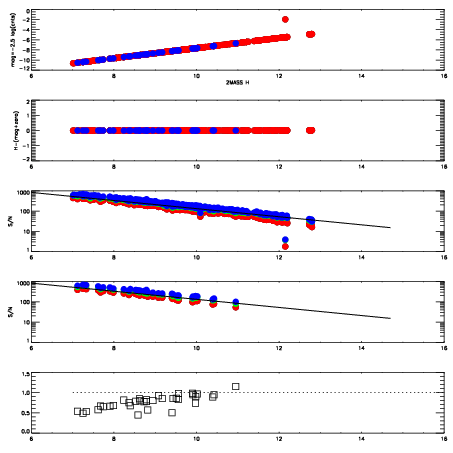
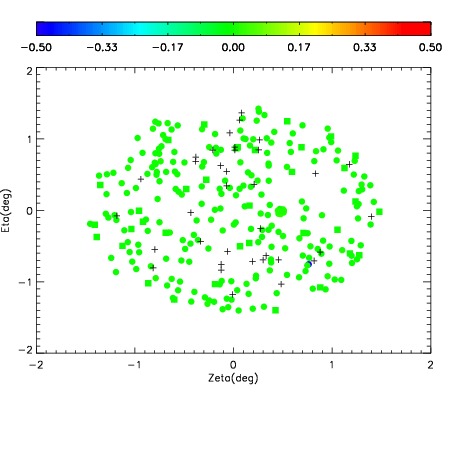
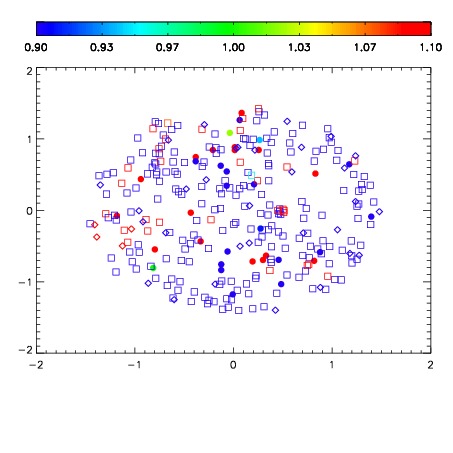
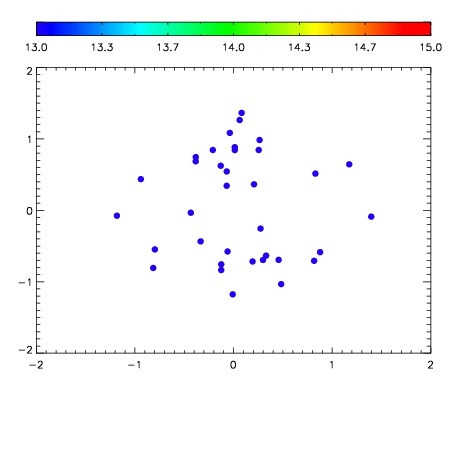

| Frame | Nreads | Zeropoints | Mag plots | Spatial mag deviation | Spatial sky 16325A emission deviations (filled: sky, open: star) | Spatial sky continuum emission | Spatial sky telluric CO2 absorption deviations (filled: H < 10) | |||||||||||||||||||||||
| 0 | 0 |
|
|
|
|
|
|
| IPAIR | NAME | SHIFT | NEWSHIFT | S/N | NAME | SHIFT | NEWSHIFT | S/N |
| 0 | 13740072 | 0.498430 | 0.00000 | 19.0502 | 13740074 | -0.00210746 | 0.500537 | 19.0464 |
| 1 | 13740076 | 0.495115 | 0.00331500 | 19.1597 | 13740077 | -0.00210092 | 0.500531 | 19.1534 |
| 2 | 13740075 | 0.495857 | 0.00257301 | 19.1384 | 13740078 | -0.00240578 | 0.500836 | 19.1002 |
| 3 | 13740079 | 0.493901 | 0.00452900 | 19.0479 | 13740073 | -0.00165845 | 0.500088 | 19.0159 |
| 4 | 13740071 | 0.496404 | 0.00202602 | 18.9952 | 13740070 | 0.00000 | 0.498430 | 19.0145 |