| Red | Green | Blue | |
| z | 17.64 | ||
| znorm | Inf | ||
| sky | -Inf | -Inf | -Inf |
| S/N | 24.0 | 42.2 | 44.8 |
| S/N(c) | 0.0 | 0.0 | 0.0 |
| SN(E/C) |
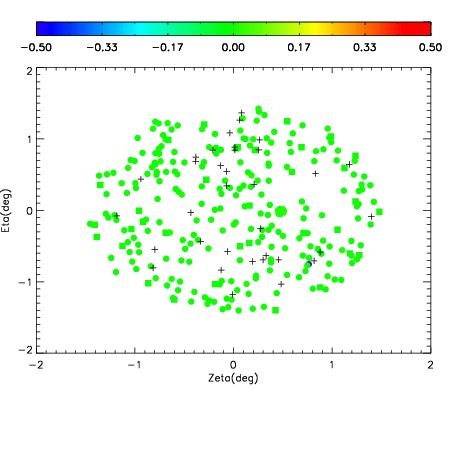
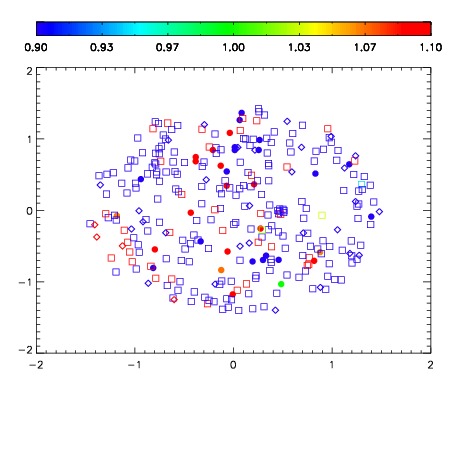
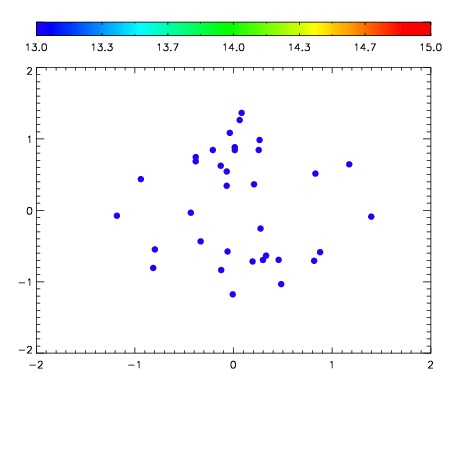

| Frame | Nreads | Zeropoints | Mag plots | Spatial mag deviation | Spatial sky 16325A emission deviations (filled: sky, open: star) | Spatial sky continuum emission | Spatial sky telluric CO2 absorption deviations (filled: H < 10) | |||||||||||||||||||||||
| 0 | 0 |
|
|
|
|
|
|
| IPAIR | NAME | SHIFT | NEWSHIFT | S/N | NAME | SHIFT | NEWSHIFT | S/N |
| 0 | 14090039 | 0.496338 | 0.00000 | 18.5443 | 14090040 | -0.000613394 | 0.496951 | 18.8269 |
| 1 | 14090042 | 0.493592 | 0.00274602 | 19.0561 | 14090044 | -0.00150125 | 0.497839 | 19.0858 |
| 2 | 14090038 | 0.493389 | 0.00294900 | 18.9936 | 14090037 | 0.00000 | 0.496338 | 18.9990 |
| 3 | 14090043 | 0.494142 | 0.00219601 | 18.9808 | 14090041 | -0.000839221 | 0.497177 | 18.9389 |