| Red | Green | Blue | |
| z | 17.64 | ||
| znorm | Inf | ||
| sky | -Inf | -Inf | -NaN |
| S/N | 29.7 | 50.5 | 56.7 |
| S/N(c) | 0.0 | 0.0 | 0.0 |
| SN(E/C) |
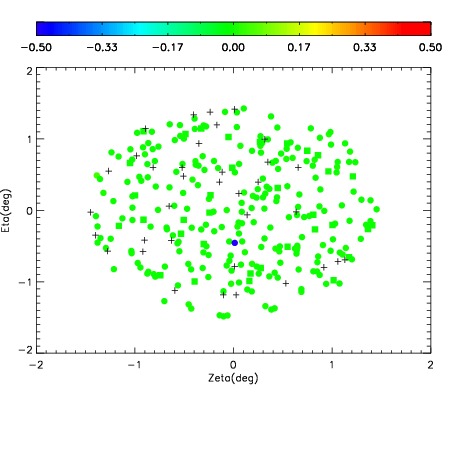
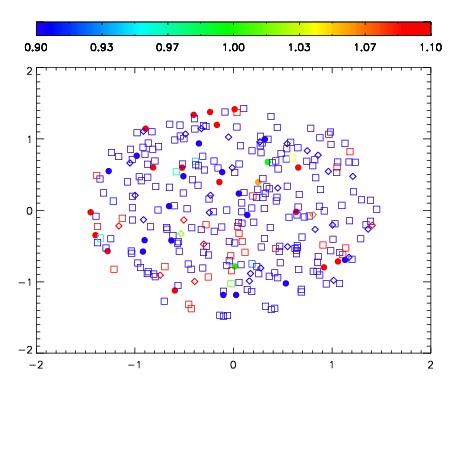
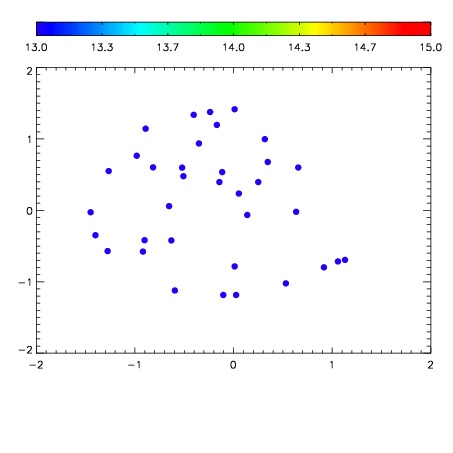

| Frame | Nreads | Zeropoints | Mag plots | Spatial mag deviation | Spatial sky 16325A emission deviations (filled: sky, open: star) | Spatial sky continuum emission | Spatial sky telluric CO2 absorption deviations (filled: H < 10) | |||||||||||||||||||||||
| 0 | 0 |
|
|
|
|
|
|
| IPAIR | NAME | SHIFT | NEWSHIFT | S/N | NAME | SHIFT | NEWSHIFT | S/N |
| 0 | 13850024 | 0.503269 | 0.00000 | 19.2819 | 13850026 | -0.00129009 | 0.504559 | 19.2653 |
| 1 | 13850023 | 0.502805 | 0.000464022 | 19.2884 | 13850022 | 0.00000 | 0.503269 | 19.2776 |
| 2 | 13850028 | 0.502455 | 0.000814021 | 19.2828 | 13850025 | -0.000895167 | 0.504164 | 19.2770 |
| 3 | 13850027 | 0.501616 | 0.00165302 | 19.2824 | 13850029 | -0.000741084 | 0.504010 | 19.2735 |