| Red | Green | Blue | |
| z | 17.64 | ||
| znorm | Inf | ||
| sky | -NaN | -Inf | -Inf |
| S/N | 3.5 | 6.0 | 6.8 |
| S/N(c) | 0.0 | 0.0 | 0.0 |
| SN(E/C) |
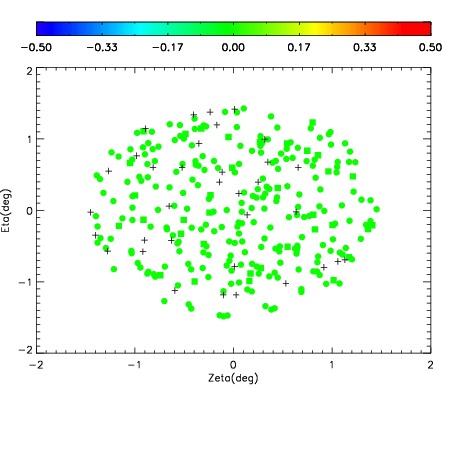
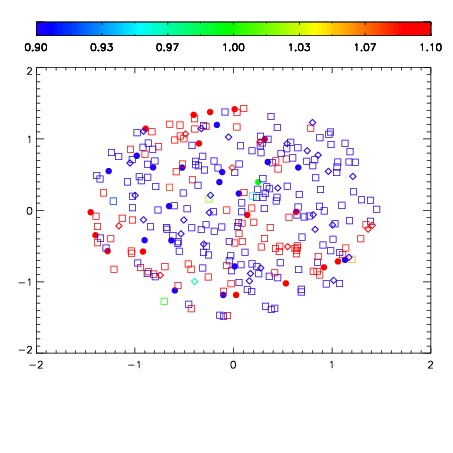


| Frame | Nreads | Zeropoints | Mag plots | Spatial mag deviation | Spatial sky 16325A emission deviations (filled: sky, open: star) | Spatial sky continuum emission | Spatial sky telluric CO2 absorption deviations (filled: H < 10) | |||||||||||||||||||||||
| 0 | 0 |
|
|
|
|
|
|
| IPAIR | NAME | SHIFT | NEWSHIFT | S/N | NAME | SHIFT | NEWSHIFT | S/N |
| 0 | 14350035 | 0.501301 | 0.00000 | 16.4811 | 14350036 | 0.00280551 | 0.498495 | 16.1225 |
| 1 | 14350030 | 0.500007 | 0.00129402 | 17.0124 | 14350029 | 0.00000 | 0.501301 | 17.7050 |
| 2 | 14350034 | 0.500805 | 0.000495970 | 16.3494 | 14350032 | 0.00224267 | 0.499058 | 16.0268 |
| 3 | 14350031 | 0.501094 | 0.000207007 | 16.3114 | 14350033 | 0.00204896 | 0.499252 | 15.9071 |