| Red | Green | Blue | |
| z | 17.64 | ||
| znorm | Inf | ||
| sky | -Inf | -Inf | -Inf |
| S/N | 28.2 | 48.3 | 49.4 |
| S/N(c) | 0.0 | 0.0 | 0.0 |
| SN(E/C) |
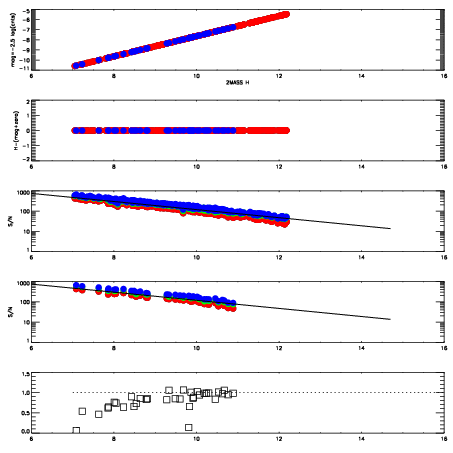
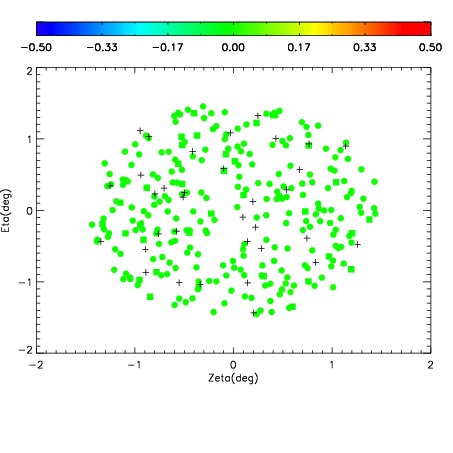
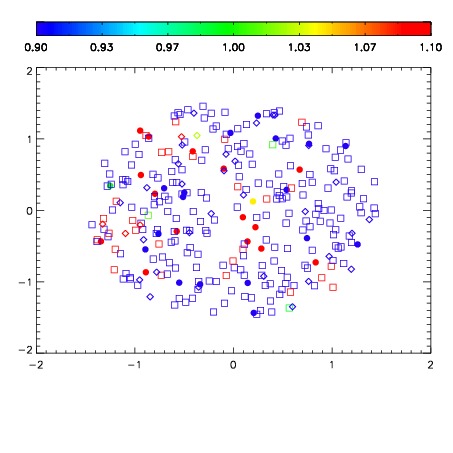
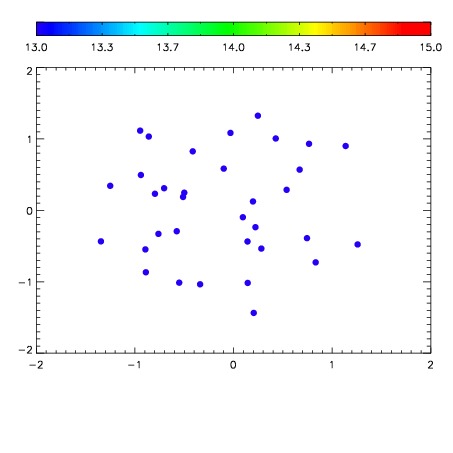

| Frame | Nreads | Zeropoints | Mag plots | Spatial mag deviation | Spatial sky 16325A emission deviations (filled: sky, open: star) | Spatial sky continuum emission | Spatial sky telluric CO2 absorption deviations (filled: H < 10) | |||||||||||||||||||||||
| 0 | 0 |
|
|
|
|
|
|
| IPAIR | NAME | SHIFT | NEWSHIFT | S/N | NAME | SHIFT | NEWSHIFT | S/N |
| 0 | 13820050 | 0.499427 | 0.00000 | 19.1488 | 13820051 | -0.000716955 | 0.500144 | 19.0377 |
| 1 | 13820049 | 0.499383 | 4.39882e-05 | 19.1633 | 13820048 | 0.00000 | 0.499427 | 19.1210 |
| 2 | 13820054 | 0.497966 | 0.00146100 | 19.0659 | 13820055 | -0.00113301 | 0.500560 | 19.0373 |
| 3 | 13820053 | 0.498409 | 0.00101799 | 19.0072 | 13820052 | -0.00103301 | 0.500460 | 18.9922 |