| Red | Green | Blue | |
| z | 17.64 | ||
| znorm | Inf | ||
| sky | -Inf | -Inf | -Inf |
| S/N | 26.0 | 44.4 | 43.9 |
| S/N(c) | 0.0 | 0.0 | 0.0 |
| SN(E/C) |
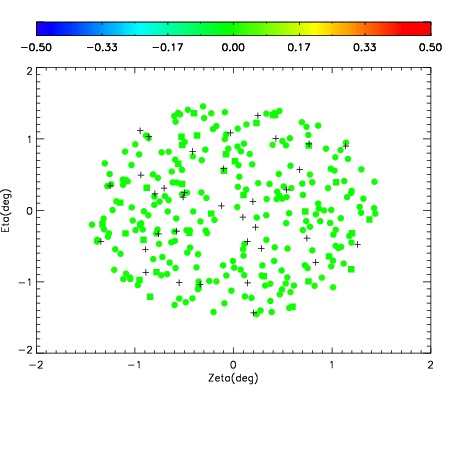
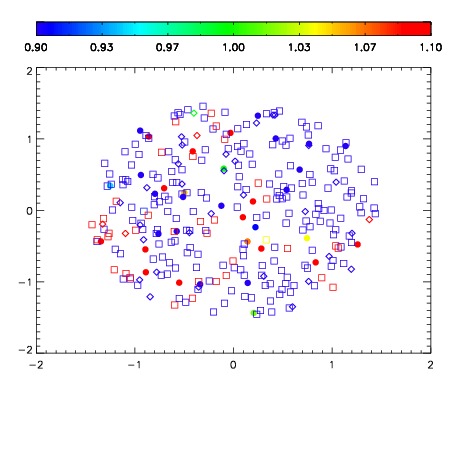
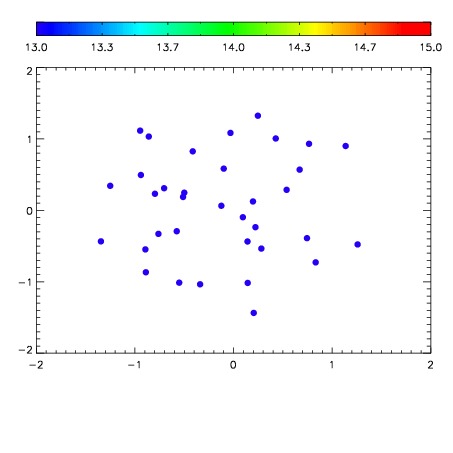

| Frame | Nreads | Zeropoints | Mag plots | Spatial mag deviation | Spatial sky 16325A emission deviations (filled: sky, open: star) | Spatial sky continuum emission | Spatial sky telluric CO2 absorption deviations (filled: H < 10) | |||||||||||||||||||||||
| 0 | 0 |
|
|
|
|
|
|
| IPAIR | NAME | SHIFT | NEWSHIFT | S/N | NAME | SHIFT | NEWSHIFT | S/N |
| 0 | 14310065 | 0.497194 | 0.00000 | 18.8509 | 14310062 | 0.000237255 | 0.496957 | 18.6748 |
| 1 | 14310061 | 0.492377 | 0.00481698 | 19.0266 | 14310063 | -0.000132428 | 0.497326 | 18.9489 |
| 2 | 14310060 | 0.491454 | 0.00573999 | 18.9484 | 14310066 | 0.00170483 | 0.495489 | 18.9063 |
| 3 | 14310064 | 0.495296 | 0.00189799 | 18.9209 | 14310059 | 0.00000 | 0.497194 | 18.8857 |