| Red | Green | Blue | |
| z | 17.64 | ||
| znorm | Inf | ||
| sky | -NaN | -Inf | -Inf |
| S/N | 24.1 | 43.9 | 47.8 |
| S/N(c) | 0.0 | 0.0 | 0.0 |
| SN(E/C) |
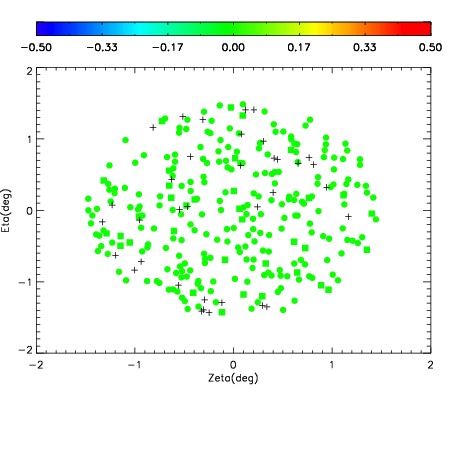
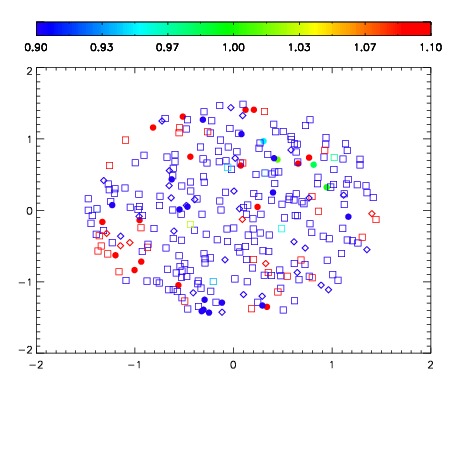
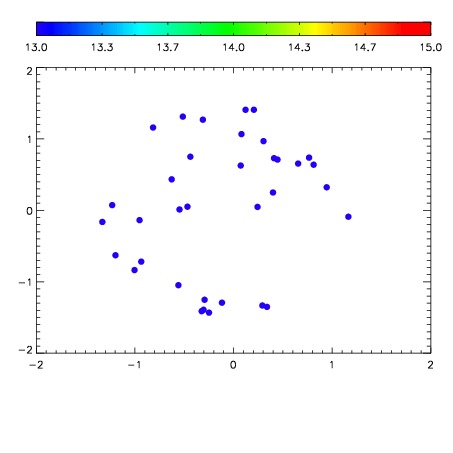

| Frame | Nreads | Zeropoints | Mag plots | Spatial mag deviation | Spatial sky 16325A emission deviations (filled: sky, open: star) | Spatial sky continuum emission | Spatial sky telluric CO2 absorption deviations (filled: H < 10) | |||||||||||||||||||||||
| 0 | 0 |
|
|
|
|
|
|
| IPAIR | NAME | SHIFT | NEWSHIFT | S/N | NAME | SHIFT | NEWSHIFT | S/N |
| 0 | 13740089 | 0.502757 | 0.00000 | 18.9324 | 13740090 | -0.000685572 | 0.503443 | 18.8856 |
| 1 | 13740084 | 0.500331 | 0.00242603 | 19.0507 | 13740083 | 0.00000 | 0.502757 | 19.0515 |
| 2 | 13740085 | 0.501303 | 0.00145400 | 18.9575 | 13740087 | -0.00118236 | 0.503939 | 18.9854 |
| 3 | 13740088 | 0.501502 | 0.00125504 | 18.9546 | 13740086 | -0.000787670 | 0.503545 | 18.9553 |