| Red | Green | Blue | |
| z | 17.64 | ||
| znorm | Inf | ||
| sky | -Inf | -Inf | -Inf |
| S/N | 26.6 | 46.8 | 49.7 |
| S/N(c) | 0.0 | 0.0 | 0.0 |
| SN(E/C) |
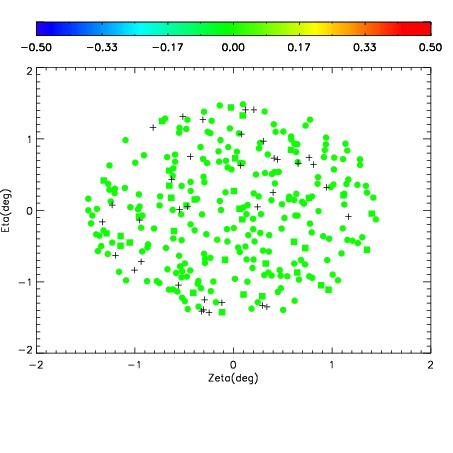


| Frame | Nreads | Zeropoints | Mag plots | Spatial mag deviation | Spatial sky 16325A emission deviations (filled: sky, open: star) | Spatial sky continuum emission | Spatial sky telluric CO2 absorption deviations (filled: H < 10) | |||||||||||||||||||||||
| 0 | 0 |
|
|
|
|
|
|
| IPAIR | NAME | SHIFT | NEWSHIFT | S/N | NAME | SHIFT | NEWSHIFT | S/N |
| 0 | 13800031 | 0.501360 | 0.00000 | 19.1448 | 13800032 | -0.000159624 | 0.501520 | 19.1062 |
| 1 | 13800030 | 0.500859 | 0.000500977 | 19.1912 | 13800029 | 0.00000 | 0.501360 | 19.1843 |
| 2 | 13800034 | 0.500443 | 0.000917017 | 19.1045 | 13800033 | -0.000593094 | 0.501953 | 19.1033 |
| 3 | 13800035 | 0.500471 | 0.000889003 | 19.0812 | 13800036 | -0.00176047 | 0.503120 | 18.9811 |