| Red | Green | Blue | |
| z | 17.64 | ||
| znorm | Inf | ||
| sky | -Inf | -Inf | -NaN |
| S/N | 24.5 | 44.5 | 45.5 |
| S/N(c) | 0.0 | 0.0 | 0.0 |
| SN(E/C) |
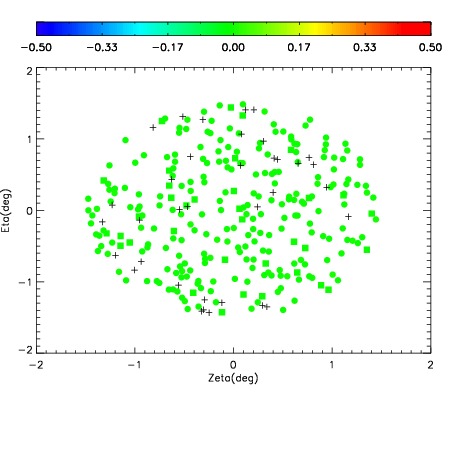
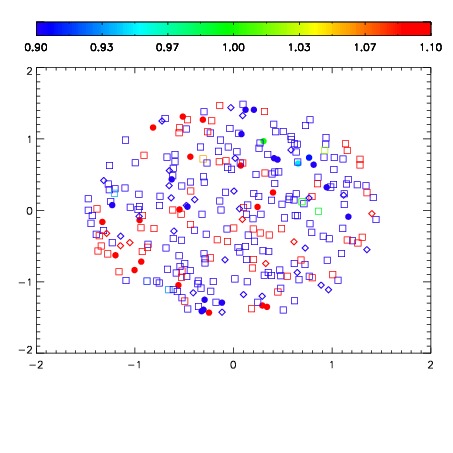
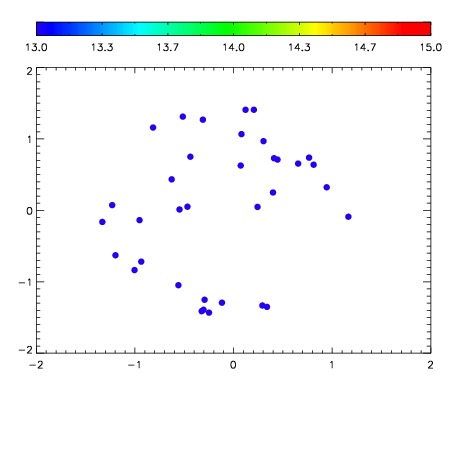

| Frame | Nreads | Zeropoints | Mag plots | Spatial mag deviation | Spatial sky 16325A emission deviations (filled: sky, open: star) | Spatial sky continuum emission | Spatial sky telluric CO2 absorption deviations (filled: H < 10) | |||||||||||||||||||||||
| 0 | 0 |
|
|
|
|
|
|
| IPAIR | NAME | SHIFT | NEWSHIFT | S/N | NAME | SHIFT | NEWSHIFT | S/N |
| 0 | 14100054 | 0.498605 | 0.00000 | 19.0260 | 14100051 | -0.000900926 | 0.499506 | 19.0817 |
| 1 | 14100050 | 0.497491 | 0.00111401 | 19.0262 | 14100052 | -0.00102934 | 0.499634 | 19.0878 |
| 2 | 14100053 | 0.498257 | 0.000348002 | 18.9671 | 14100055 | -0.00115532 | 0.499760 | 19.0434 |
| 3 | 14100049 | 0.497049 | 0.00155601 | 18.8854 | 14100048 | 0.00000 | 0.498605 | 18.9128 |