| Red | Green | Blue | |
| z | 17.64 | ||
| znorm | Inf | ||
| sky | -NaN | -NaN | -NaN |
| S/N | 29.8 | 51.7 | 57.2 |
| S/N(c) | 0.0 | 0.0 | 0.0 |
| SN(E/C) |
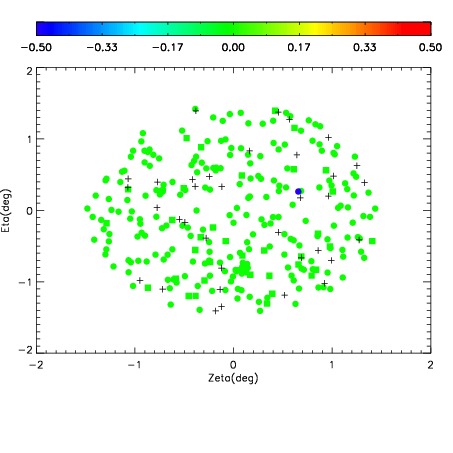
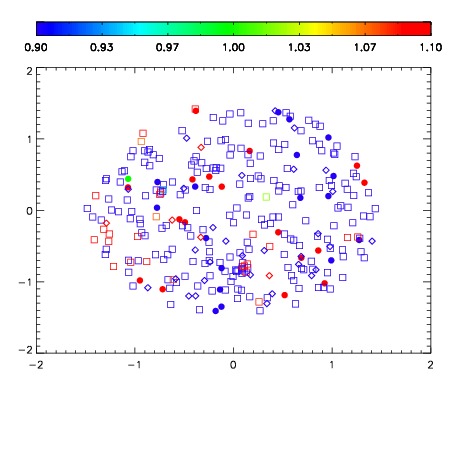


| Frame | Nreads | Zeropoints | Mag plots | Spatial mag deviation | Spatial sky 16325A emission deviations (filled: sky, open: star) | Spatial sky continuum emission | Spatial sky telluric CO2 absorption deviations (filled: H < 10) | |||||||||||||||||||||||
| 0 | 0 |
|
|
|
|
|
|
| IPAIR | NAME | SHIFT | NEWSHIFT | S/N | NAME | SHIFT | NEWSHIFT | S/N |
| 0 | 13820039 | 0.496360 | 0.00000 | 19.1215 | 13820037 | 0.00000 | 0.496360 | 19.1099 |
| 1 | 13820042 | 0.492721 | 0.00363901 | 19.1687 | 13820044 | -0.00282647 | 0.499186 | 19.1902 |
| 2 | 13820043 | 0.493172 | 0.00318801 | 19.1660 | 13820041 | -0.00160198 | 0.497962 | 19.1711 |
| 3 | 13820038 | 0.494416 | 0.00194401 | 19.1224 | 13820040 | -0.00102512 | 0.497385 | 19.1396 |