| Red | Green | Blue | |
| z | 17.64 | ||
| znorm | Inf | ||
| sky | -Inf | -Inf | -Inf |
| S/N | 32.9 | 55.1 | 59.1 |
| S/N(c) | 0.0 | 0.0 | 0.0 |
| SN(E/C) |
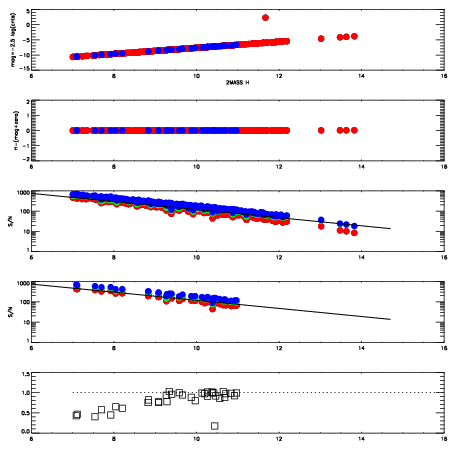
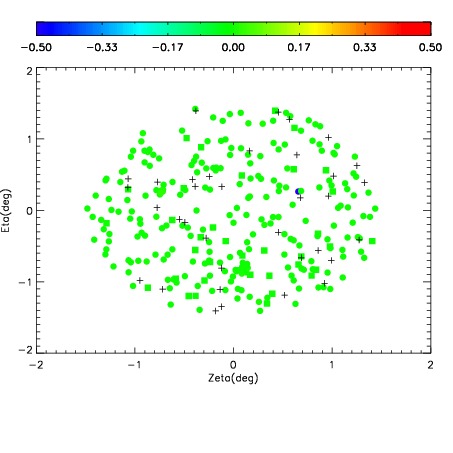
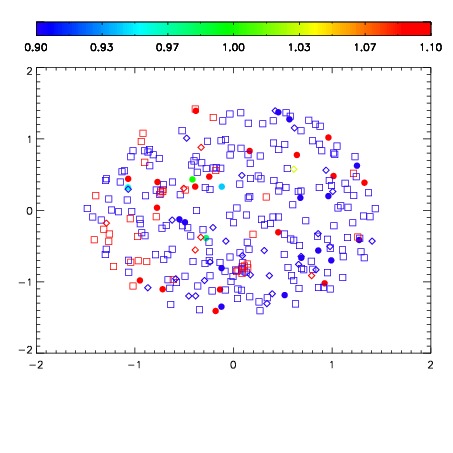
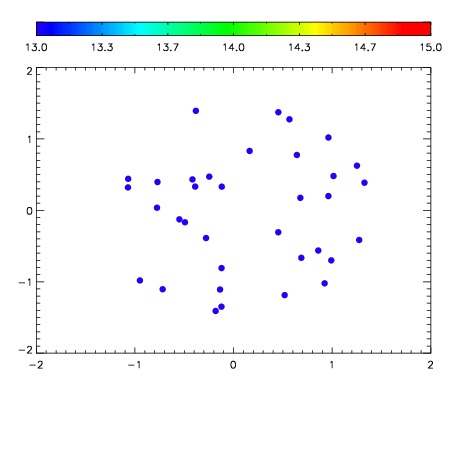

| Frame | Nreads | Zeropoints | Mag plots | Spatial mag deviation | Spatial sky 16325A emission deviations (filled: sky, open: star) | Spatial sky continuum emission | Spatial sky telluric CO2 absorption deviations (filled: H < 10) | |||||||||||||||||||||||
| 0 | 0 |
|
|
|
|
|
|
| IPAIR | NAME | SHIFT | NEWSHIFT | S/N | NAME | SHIFT | NEWSHIFT | S/N |
| 0 | 13850013 | 0.500489 | 0.00000 | 19.2674 | 13850015 | 5.15934e-05 | 0.500437 | 19.2585 |
| 1 | 13850017 | 0.499808 | 0.000680983 | 19.2676 | 13850018 | -0.000726545 | 0.501216 | 19.2773 |
| 2 | 13850016 | 0.499536 | 0.000952989 | 19.2580 | 13850014 | 0.000141266 | 0.500348 | 19.2508 |
| 3 | 13850012 | 0.499942 | 0.000546992 | 19.2492 | 13850011 | 0.00000 | 0.500489 | 19.2459 |