| Red | Green | Blue | |
| z | 17.64 | ||
| znorm | Inf | ||
| sky | -Inf | -Inf | -NaN |
| S/N | 22.2 | 41.4 | 43.5 |
| S/N(c) | 0.0 | 0.0 | 0.0 |
| SN(E/C) |
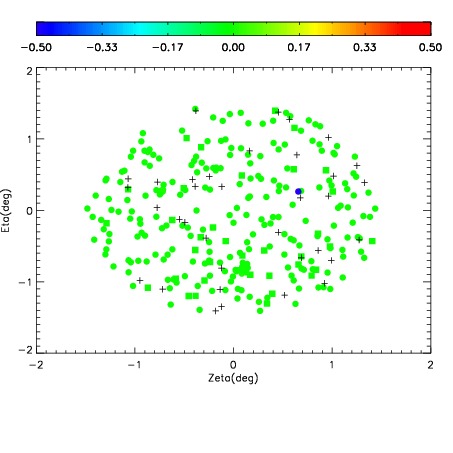
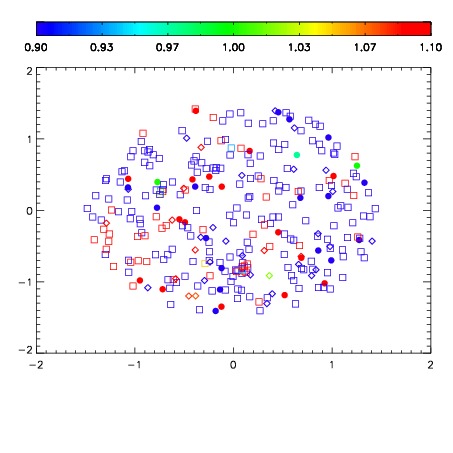
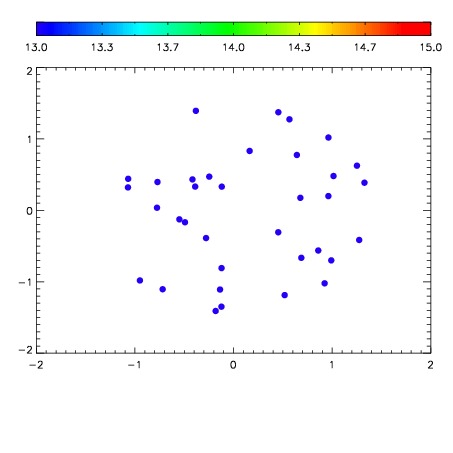

| Frame | Nreads | Zeropoints | Mag plots | Spatial mag deviation | Spatial sky 16325A emission deviations (filled: sky, open: star) | Spatial sky continuum emission | Spatial sky telluric CO2 absorption deviations (filled: H < 10) | |||||||||||||||||||||||
| 0 | 0 |
|
|
|
|
|
|
| IPAIR | NAME | SHIFT | NEWSHIFT | S/N | NAME | SHIFT | NEWSHIFT | S/N |
| 0 | 14100042 | 0.493913 | 0.00000 | 18.7072 | 14100041 | -0.000900552 | 0.494814 | 18.3406 |
| 1 | 14100043 | 0.492382 | 0.00153100 | 18.8949 | 14100044 | -0.00255722 | 0.496470 | 18.9047 |
| 2 | 14100038 | 0.493128 | 0.000784993 | 18.7775 | 14100037 | 0.00000 | 0.493913 | 18.8672 |
| 3 | 14100039 | 0.493214 | 0.000698984 | 18.7438 | 14100040 | -0.00134799 | 0.495261 | 18.5047 |