| Red | Green | Blue | |
| z | 17.64 | ||
| znorm | Inf | ||
| sky | -Inf | -Inf | -NaN |
| S/N | 31.1 | 50.3 | 55.6 |
| S/N(c) | 0.0 | 0.0 | 0.0 |
| SN(E/C) |
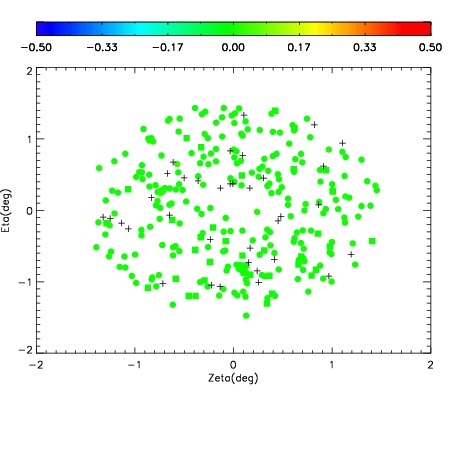
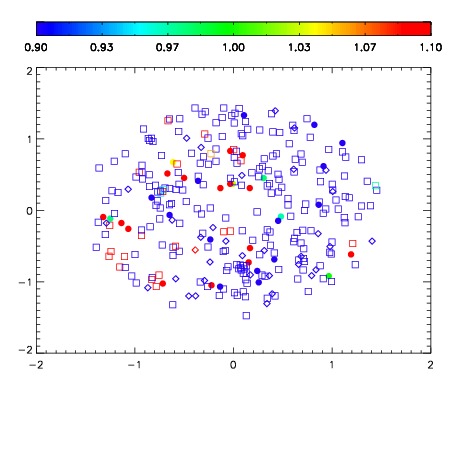
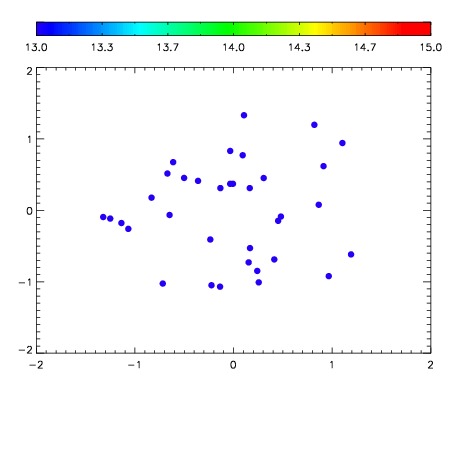

| Frame | Nreads | Zeropoints | Mag plots | Spatial mag deviation | Spatial sky 16325A emission deviations (filled: sky, open: star) | Spatial sky continuum emission | Spatial sky telluric CO2 absorption deviations (filled: H < 10) | |||||||||||||||||||||||
| 0 | 0 |
|
|
|
|
|
|
| IPAIR | NAME | SHIFT | NEWSHIFT | S/N | NAME | SHIFT | NEWSHIFT | S/N |
| 0 | 13840032 | 0.498035 | 0.00000 | 19.2698 | 13840030 | -0.00106232 | 0.499097 | 19.2669 |
| 1 | 13840031 | 0.497408 | 0.000627011 | 19.3033 | 13840033 | -0.00171320 | 0.499748 | 19.2708 |
| 2 | 13840027 | 0.495414 | 0.00262102 | 19.2507 | 13840029 | -0.00124713 | 0.499282 | 19.2602 |
| 3 | 13840028 | 0.496413 | 0.00162202 | 19.2326 | 13840026 | 0.00000 | 0.498035 | 19.2464 |