| Red | Green | Blue | |
| z | 17.64 | ||
| znorm | Inf | ||
| sky | -NaN | -NaN | -NaN |
| S/N | 27.4 | 47.0 | 49.7 |
| S/N(c) | 0.0 | 0.0 | 0.0 |
| SN(E/C) |
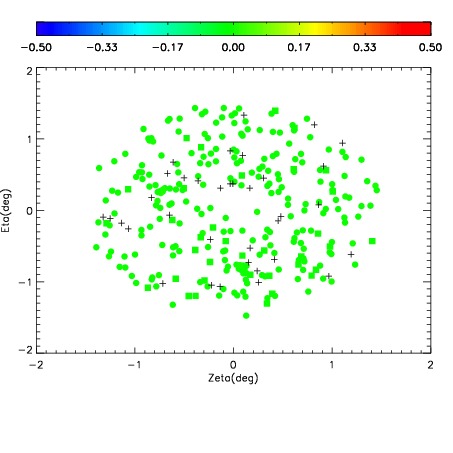
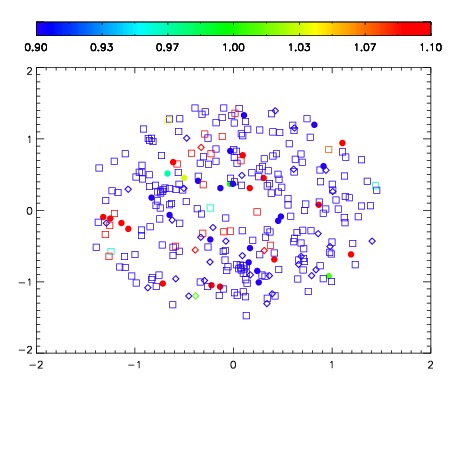
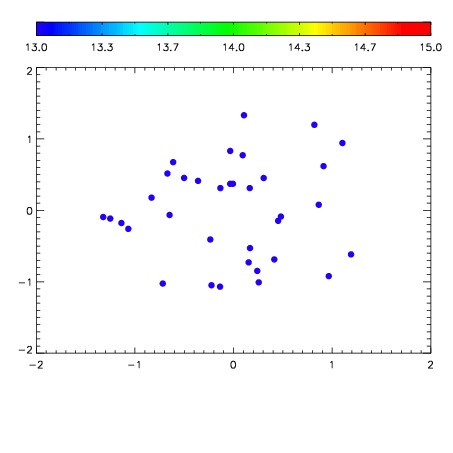

| Frame | Nreads | Zeropoints | Mag plots | Spatial mag deviation | Spatial sky 16325A emission deviations (filled: sky, open: star) | Spatial sky continuum emission | Spatial sky telluric CO2 absorption deviations (filled: H < 10) | |||||||||||||||||||||||
| 0 | 0 |
|
|
|
|
|
|
| IPAIR | NAME | SHIFT | NEWSHIFT | S/N | NAME | SHIFT | NEWSHIFT | S/N |
| 0 | 14300045 | 0.497017 | 0.00000 | 19.0957 | 14300048 | -0.00203158 | 0.499049 | 19.0805 |
| 1 | 14300049 | 0.495926 | 0.00109100 | 19.1016 | 14300051 | -0.00224375 | 0.499261 | 19.0815 |
| 2 | 14300050 | 0.496633 | 0.000384003 | 19.0883 | 14300047 | -0.00142885 | 0.498446 | 19.0762 |
| 3 | 14300046 | 0.496711 | 0.000306010 | 19.0438 | 14300044 | 0.00000 | 0.497017 | 19.0163 |