| Red | Green | Blue | |
| z | 17.64 | ||
| znorm | Inf | ||
| sky | -NaN | -NaN | -Inf |
| S/N | 5.5 | 8.8 | 9.7 |
| S/N(c) | 0.0 | 0.0 | 0.0 |
| SN(E/C) |
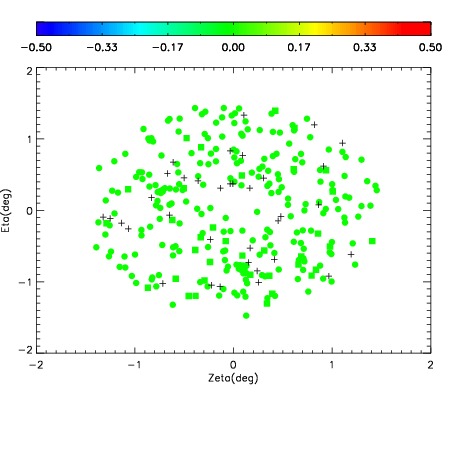
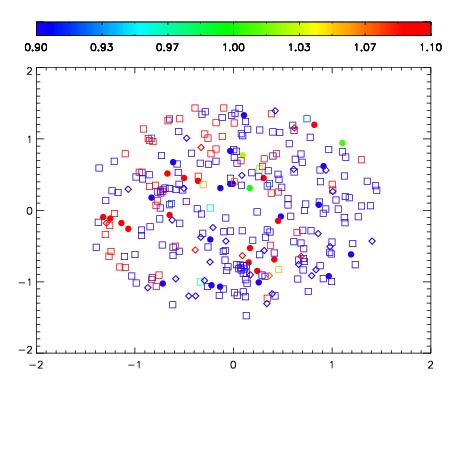
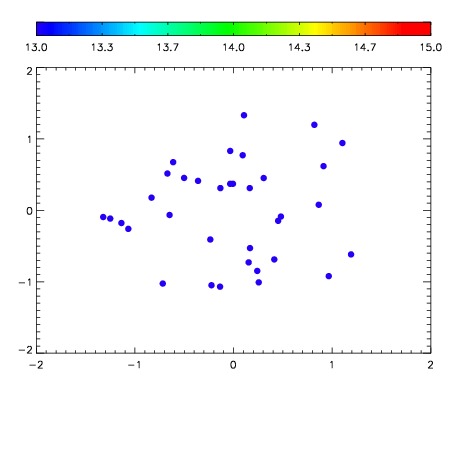

| Frame | Nreads | Zeropoints | Mag plots | Spatial mag deviation | Spatial sky 16325A emission deviations (filled: sky, open: star) | Spatial sky continuum emission | Spatial sky telluric CO2 absorption deviations (filled: H < 10) | |||||||||||||||||||||||
| 0 | 0 |
|
|
|
|
|
|
| IPAIR | NAME | SHIFT | NEWSHIFT | S/N | NAME | SHIFT | NEWSHIFT | S/N |
| 0 | 14350042 | 0.499300 | 0.00000 | 16.4014 | 14350044 | -0.000124361 | 0.499424 | 17.4059 |
| 1 | 14350046 | 0.499036 | 0.000263989 | 17.4320 | 14350047 | -2.74495e-05 | 0.499327 | 17.6149 |
| 2 | 14350045 | 0.497987 | 0.00131300 | 17.2555 | 14350043 | -0.000712533 | 0.500013 | 17.5937 |
| 3 | 14350041 | 0.498981 | 0.000319004 | 15.8135 | 14350040 | 0.00000 | 0.499300 | 15.6457 |