| Red | Green | Blue | |
| z | 17.64 | ||
| znorm | Inf | ||
| sky | -Inf | -Inf | -NaN |
| S/N | 28.8 | 47.9 | 51.8 |
| S/N(c) | 0.0 | 0.0 | 0.0 |
| SN(E/C) |
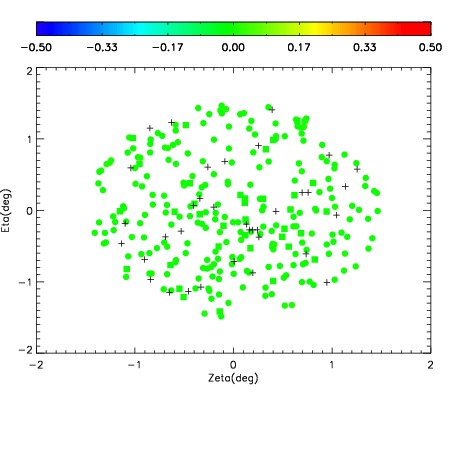
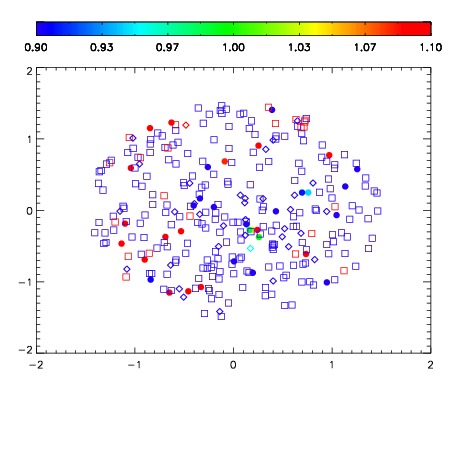
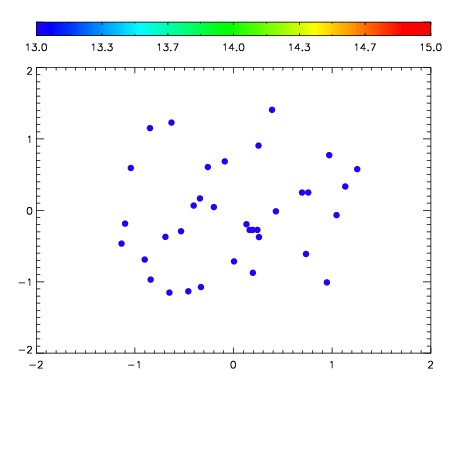

| Frame | Nreads | Zeropoints | Mag plots | Spatial mag deviation | Spatial sky 16325A emission deviations (filled: sky, open: star) | Spatial sky continuum emission | Spatial sky telluric CO2 absorption deviations (filled: H < 10) | |||||||||||||||||||||||
| 0 | 0 |
|
|
|
|
|
|
| IPAIR | NAME | SHIFT | NEWSHIFT | S/N | NAME | SHIFT | NEWSHIFT | S/N |
| 0 | 13840038 | 0.497511 | 0.00000 | 19.2134 | 13840040 | 0.000971946 | 0.496539 | 19.2202 |
| 1 | 13840039 | 0.496883 | 0.000627995 | 19.2406 | 13840037 | 0.00000 | 0.497511 | 19.2285 |
| 2 | 13840043 | 0.496574 | 0.000936985 | 19.1383 | 13840041 | 0.00116581 | 0.496345 | 19.1738 |
| 3 | 13840042 | 0.496885 | 0.000625998 | 19.1172 | 13840044 | 0.000239960 | 0.497271 | 19.0893 |