| Red | Green | Blue | |
| z | 17.64 | ||
| znorm | Inf | ||
| sky | -Inf | -Inf | -Inf |
| S/N | 30.9 | 50.4 | 55.7 |
| S/N(c) | 0.0 | 0.0 | 0.0 |
| SN(E/C) |
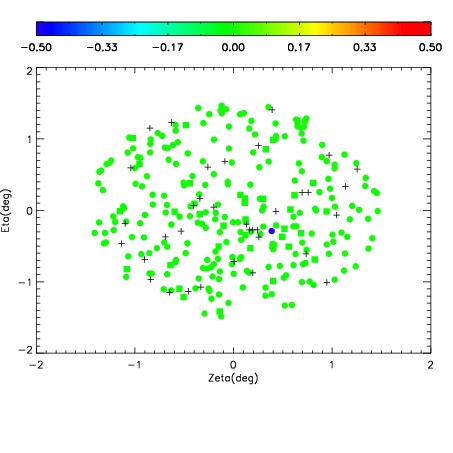
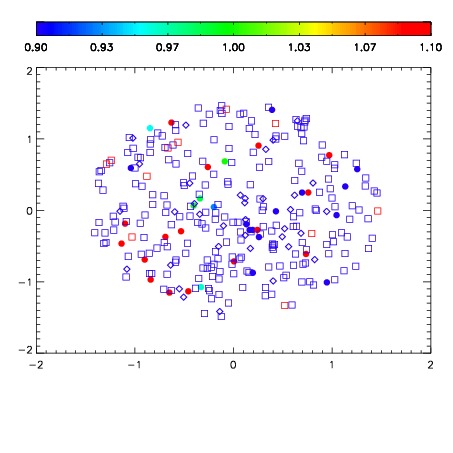
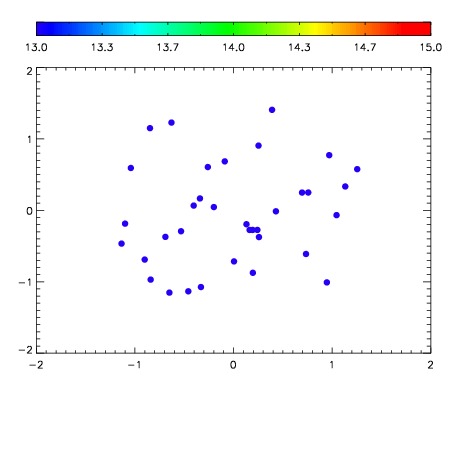

| Frame | Nreads | Zeropoints | Mag plots | Spatial mag deviation | Spatial sky 16325A emission deviations (filled: sky, open: star) | Spatial sky continuum emission | Spatial sky telluric CO2 absorption deviations (filled: H < 10) | |||||||||||||||||||||||
| 0 | 0 |
|
|
|
|
|
|
| IPAIR | NAME | SHIFT | NEWSHIFT | S/N | NAME | SHIFT | NEWSHIFT | S/N |
| 0 | 14410032 | 0.489877 | 0.00000 | 19.2102 | 14410033 | -0.000910800 | 0.490788 | 19.1674 |
| 1 | 14410027 | 0.486100 | 0.00377700 | 19.2226 | 14410026 | 0.00000 | 0.489877 | 19.2178 |
| 2 | 14410028 | 0.488578 | 0.00129899 | 19.2112 | 14410029 | -0.00138677 | 0.491264 | 19.1803 |
| 3 | 14410031 | 0.488751 | 0.00112599 | 19.2089 | 14410030 | -0.00153559 | 0.491413 | 19.1551 |