| Red | Green | Blue | |
| z | 17.64 | ||
| znorm | Inf | ||
| sky | -Inf | -NaN | -NaN |
| S/N | 32.7 | 53.6 | 59.3 |
| S/N(c) | 0.0 | 0.0 | 0.0 |
| SN(E/C) |
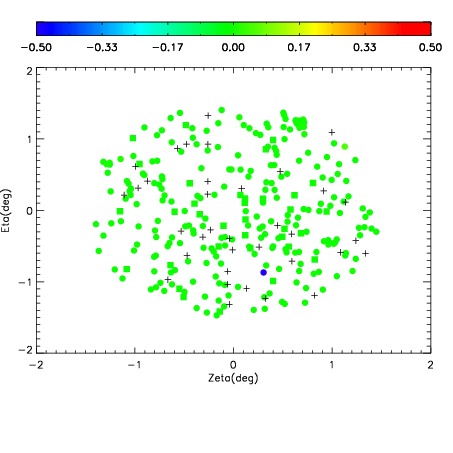
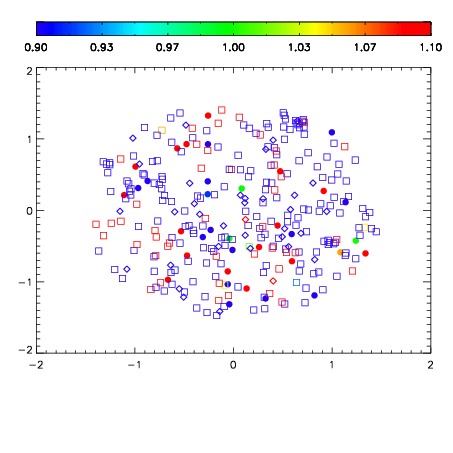
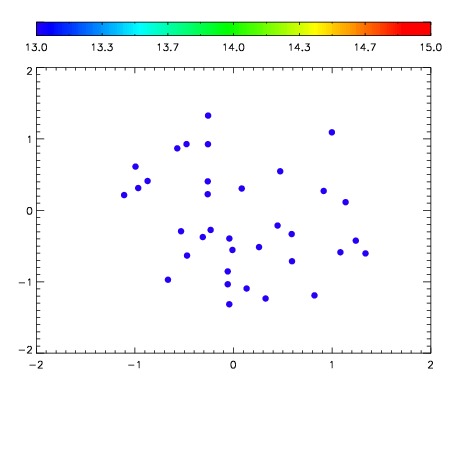

| Frame | Nreads | Zeropoints | Mag plots | Spatial mag deviation | Spatial sky 16325A emission deviations (filled: sky, open: star) | Spatial sky continuum emission | Spatial sky telluric CO2 absorption deviations (filled: H < 10) | |||||||||||||||||||||||
| 0 | 0 |
|
|
|
|
|
|
| IPAIR | NAME | SHIFT | NEWSHIFT | S/N | NAME | SHIFT | NEWSHIFT | S/N |
| 0 | 14400039 | 0.496090 | 0.00000 | 19.2215 | 14400044 | 0.000240080 | 0.495850 | 19.2251 |
| 1 | 14400042 | 0.495584 | 0.000505984 | 19.2534 | 14400041 | -0.00188919 | 0.497979 | 19.2470 |
| 2 | 14400043 | 0.495955 | 0.000135005 | 19.2287 | 14400040 | -0.00125195 | 0.497342 | 19.2415 |
| 3 | 14400038 | 0.495529 | 0.000560999 | 19.1899 | 14400037 | 0.00000 | 0.496090 | 19.1855 |