| Red | Green | Blue | |
| z | 17.64 | ||
| znorm | Inf | ||
| sky | -Inf | -Inf | -NaN |
| S/N | 26.8 | 45.9 | 48.0 |
| S/N(c) | 0.0 | 0.0 | 0.0 |
| SN(E/C) |
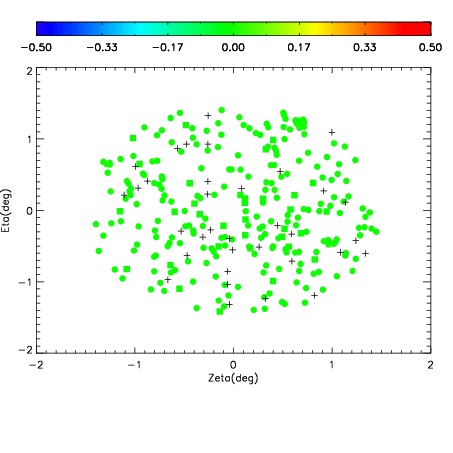
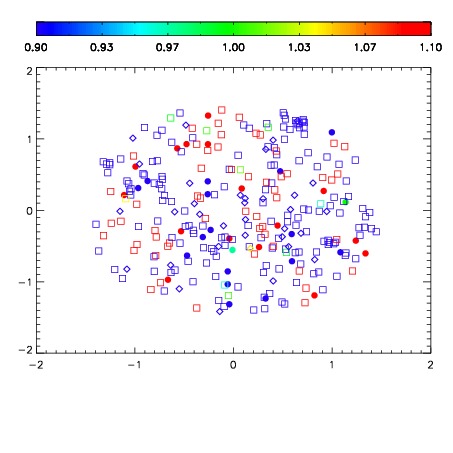
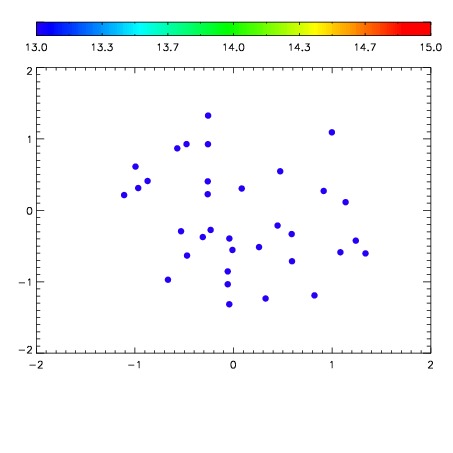

| Frame | Nreads | Zeropoints | Mag plots | Spatial mag deviation | Spatial sky 16325A emission deviations (filled: sky, open: star) | Spatial sky continuum emission | Spatial sky telluric CO2 absorption deviations (filled: H < 10) | |||||||||||||||||||||||
| 0 | 0 |
|
|
|
|
|
|
| IPAIR | NAME | SHIFT | NEWSHIFT | S/N | NAME | SHIFT | NEWSHIFT | S/N |
| 0 | 14590043 | 0.499465 | 0.00000 | 18.9633 | 14590044 | 0.00155329 | 0.497912 | 19.0048 |
| 1 | 14590042 | 0.498994 | 0.000470996 | 18.9502 | 14590041 | 0.00171225 | 0.497753 | 18.9513 |
| 2 | 14590038 | 0.497541 | 0.00192398 | 18.9449 | 14590040 | 0.00167407 | 0.497791 | 18.9315 |
| 3 | 14590039 | 0.499278 | 0.000186980 | 18.8941 | 14590037 | 0.00000 | 0.499465 | 18.9193 |