| Red | Green | Blue | |
| z | 17.64 | ||
| znorm | Inf | ||
| sky | -Inf | -NaN | -NaN |
| S/N | 23.7 | 42.2 | 45.5 |
| S/N(c) | 0.0 | 0.0 | 0.0 |
| SN(E/C) |
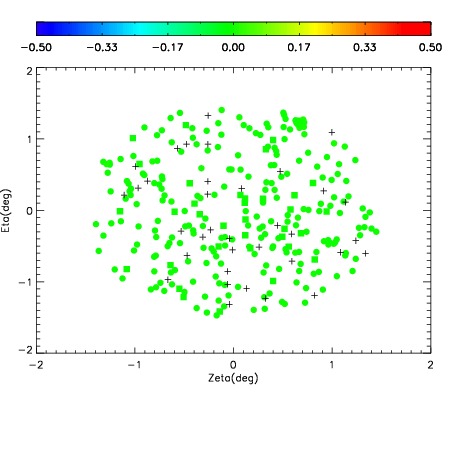
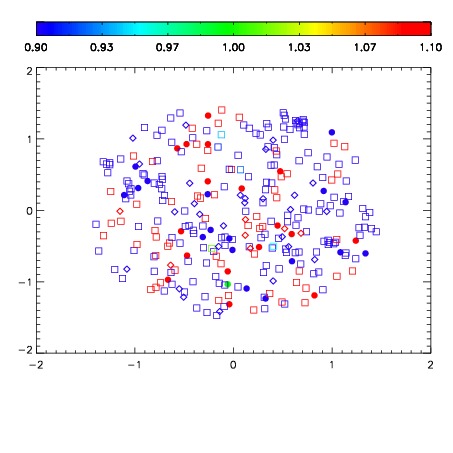
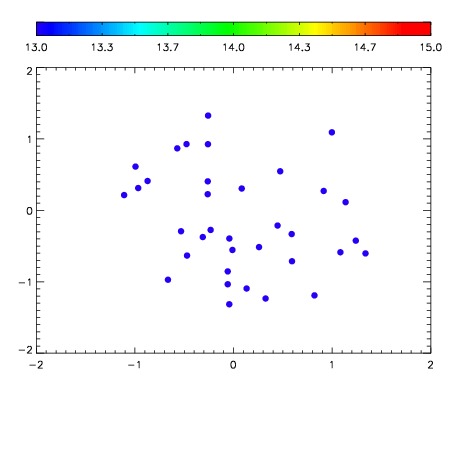

| Frame | Nreads | Zeropoints | Mag plots | Spatial mag deviation | Spatial sky 16325A emission deviations (filled: sky, open: star) | Spatial sky continuum emission | Spatial sky telluric CO2 absorption deviations (filled: H < 10) | |||||||||||||||||||||||
| 0 | 0 |
|
|
|
|
|
|
| IPAIR | NAME | SHIFT | NEWSHIFT | S/N | NAME | SHIFT | NEWSHIFT | S/N |
| 0 | 14670039 | 0.497107 | 0.00000 | 18.6963 | 14670037 | 0.000380423 | 0.496727 | 18.6749 |
| 1 | 14670034 | 0.494756 | 0.00235099 | 18.8391 | 14670033 | 0.00000 | 0.497107 | 18.7568 |
| 2 | 14670035 | 0.495969 | 0.00113800 | 18.8146 | 14670036 | 0.000449830 | 0.496657 | 18.6821 |
| 3 | 14670038 | 0.496542 | 0.000564992 | 18.6422 | 14670040 | 0.000609210 | 0.496498 | 18.6301 |