| Red | Green | Blue | |
| z | 17.64 | ||
| znorm | Inf | ||
| sky | -Inf | -NaN | -NaN |
| S/N | 26.9 | 45.9 | 51.8 |
| S/N(c) | 0.0 | 0.0 | 0.0 |
| SN(E/C) |
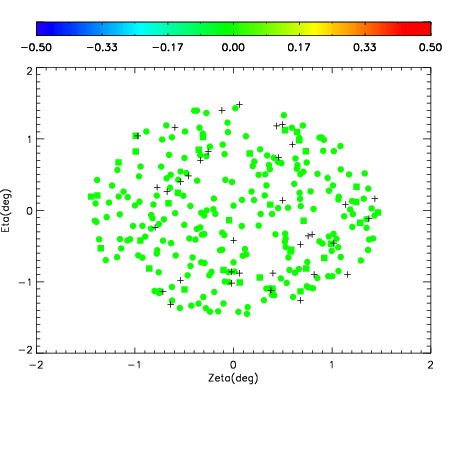
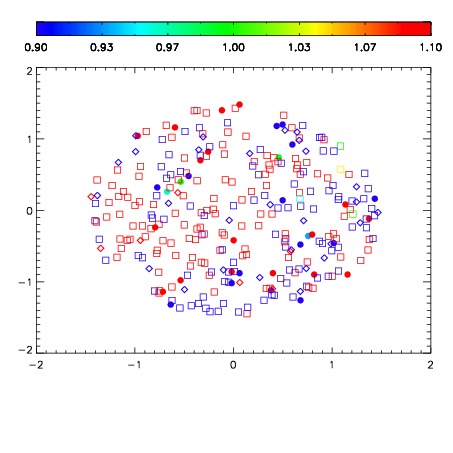


| Frame | Nreads | Zeropoints | Mag plots | Spatial mag deviation | Spatial sky 16325A emission deviations (filled: sky, open: star) | Spatial sky continuum emission | Spatial sky telluric CO2 absorption deviations (filled: H < 10) | |||||||||||||||||||||||
| 0 | 0 |
|
|
|
|
|
|
| IPAIR | NAME | SHIFT | NEWSHIFT | S/N | NAME | SHIFT | NEWSHIFT | S/N |
| 0 | 16110027 | 0.493738 | 0.00000 | 19.1121 | 16110026 | 0.000212887 | 0.493525 | 19.1593 |
| 1 | 16110023 | 0.493483 | 0.000254989 | 19.1342 | 16110025 | 0.000791099 | 0.492947 | 19.1689 |
| 2 | 16110028 | 0.493678 | 5.99921e-05 | 18.9958 | 16110022 | 0.00000 | 0.493738 | 19.1405 |
| 3 | 16110024 | 0.493406 | 0.000331998 | 18.9157 | 16110029 | 0.000919380 | 0.492819 | 19.0979 |