| Red | Green | Blue | |
| z | 17.64 | ||
| znorm | Inf | ||
| sky | -Inf | -NaN | -Inf |
| S/N | 28.5 | 46.7 | 51.2 |
| S/N(c) | 0.0 | 0.0 | 0.0 |
| SN(E/C) |
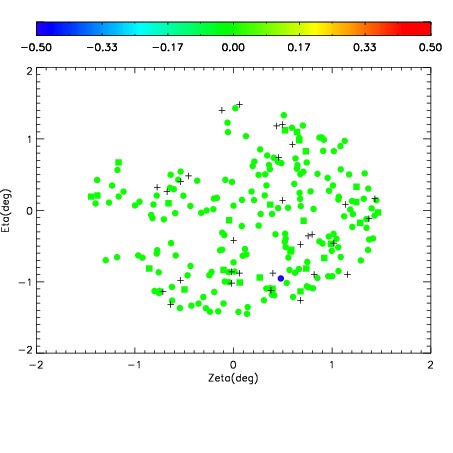
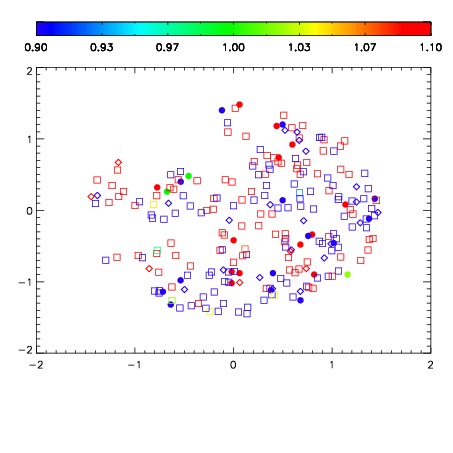
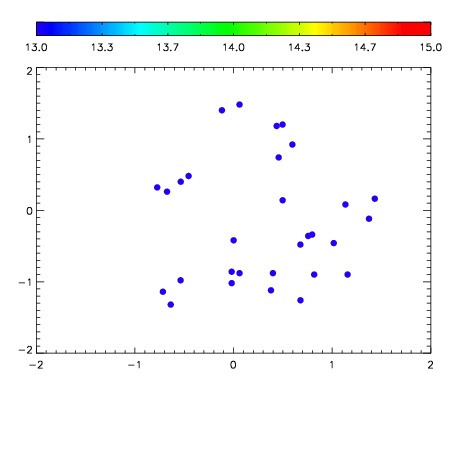

| Frame | Nreads | Zeropoints | Mag plots | Spatial mag deviation | Spatial sky 16325A emission deviations (filled: sky, open: star) | Spatial sky continuum emission | Spatial sky telluric CO2 absorption deviations (filled: H < 10) | |||||||||||||||||||||||
| 0 | 0 |
|
|
|
|
|
|
| IPAIR | NAME | SHIFT | NEWSHIFT | S/N | NAME | SHIFT | NEWSHIFT | S/N |
| 0 | 16430024 | 0.488746 | 0.00000 | 19.1064 | 16430018 | 0.00000 | 0.488746 | 19.0789 |
| 1 | 16430023 | 0.487802 | 0.000943989 | 19.1184 | 16430025 | 0.00223586 | 0.486510 | 19.1286 |
| 2 | 16430019 | 0.487154 | 0.00159198 | 19.1108 | 16430022 | 0.00193723 | 0.486809 | 19.1096 |
| 3 | 16430020 | 0.487137 | 0.00160900 | 19.0662 | 16430021 | 0.00155316 | 0.487193 | 19.0499 |