| Red | Green | Blue | |
| z | 17.64 | ||
| znorm | Inf | ||
| sky | -Inf | -NaN | -Inf |
| S/N | 26.4 | 43.7 | 51.6 |
| S/N(c) | 0.0 | 0.0 | 0.0 |
| SN(E/C) |
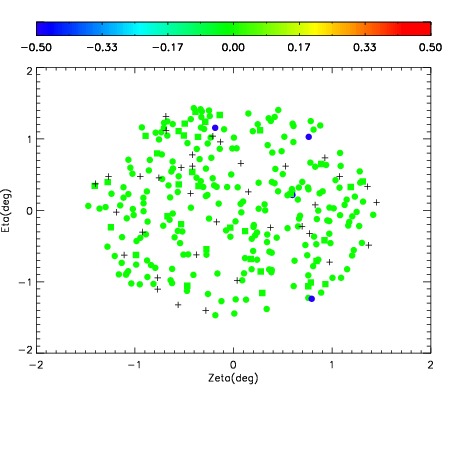
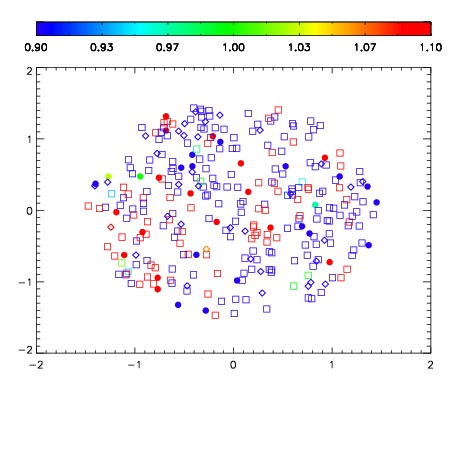
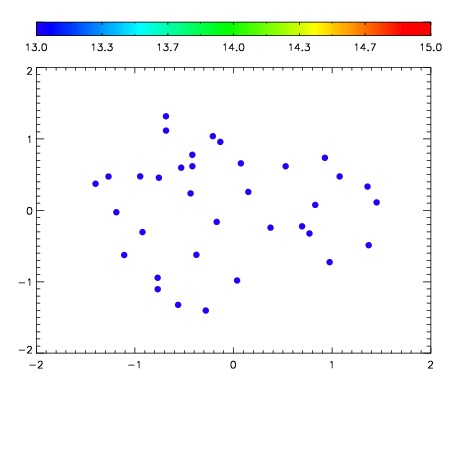

| Frame | Nreads | Zeropoints | Mag plots | Spatial mag deviation | Spatial sky 16325A emission deviations (filled: sky, open: star) | Spatial sky continuum emission | Spatial sky telluric CO2 absorption deviations (filled: H < 10) | |||||||||||||||||||||||
| 0 | 0 |
|
|
|
|
|
|
| IPAIR | NAME | SHIFT | NEWSHIFT | S/N | NAME | SHIFT | NEWSHIFT | S/N |
| 0 | 17310049 | 0.510272 | 0.00000 | 18.9495 | 17310043 | 0.00000 | 0.510272 | 18.9319 |
| 1 | 17310045 | 0.507399 | 0.00287300 | 19.0552 | 17310046 | 0.00319466 | 0.507077 | 19.0459 |
| 2 | 17310048 | 0.509321 | 0.000951052 | 19.0396 | 17310050 | 0.00511286 | 0.505159 | 19.0166 |
| 3 | 17310044 | 0.506499 | 0.00377303 | 18.9553 | 17310047 | 0.00306274 | 0.507209 | 18.9728 |