| Red | Green | Blue | |
| z | 17.64 | ||
| znorm | Inf | ||
| sky | -Inf | -Inf | -NaN |
| S/N | 27.8 | 44.2 | 54.1 |
| S/N(c) | 0.0 | 0.0 | 0.0 |
| SN(E/C) |
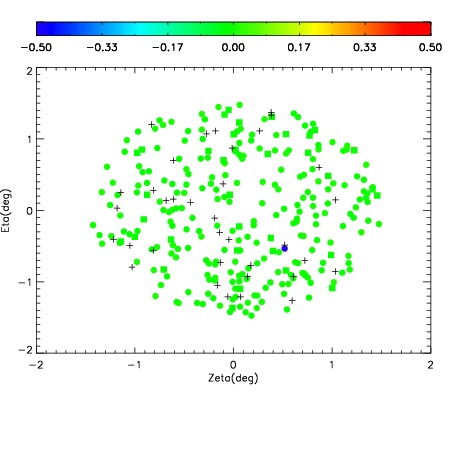
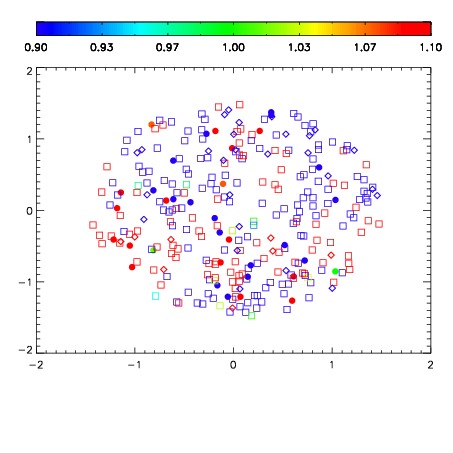


| Frame | Nreads | Zeropoints | Mag plots | Spatial mag deviation | Spatial sky 16325A emission deviations (filled: sky, open: star) | Spatial sky continuum emission | Spatial sky telluric CO2 absorption deviations (filled: H < 10) | |||||||||||||||||||||||
| 0 | 0 |
|
|
|
|
|
|
| IPAIR | NAME | SHIFT | NEWSHIFT | S/N | NAME | SHIFT | NEWSHIFT | S/N |
| 0 | 17030028 | 0.488197 | 0.00000 | 18.9588 | 17030026 | -0.00159186 | 0.489789 | 18.9813 |
| 1 | 17030024 | 0.487644 | 0.000553012 | 18.9987 | 17030022 | 0.00000 | 0.488197 | 19.0500 |
| 2 | 17030023 | 0.486551 | 0.00164601 | 18.9090 | 17030029 | 0.00367762 | 0.484519 | 18.9273 |
| 3 | 17030027 | 0.487499 | 0.000698000 | 18.8943 | 17030025 | -0.000883166 | 0.489080 | 18.9122 |