| Red | Green | Blue | |
| z | 17.64 | ||
| znorm | Inf | ||
| sky | -Inf | -Inf | -Inf |
| S/N | 25.0 | 40.5 | 49.6 |
| S/N(c) | 0.0 | 0.0 | 0.0 |
| SN(E/C) |
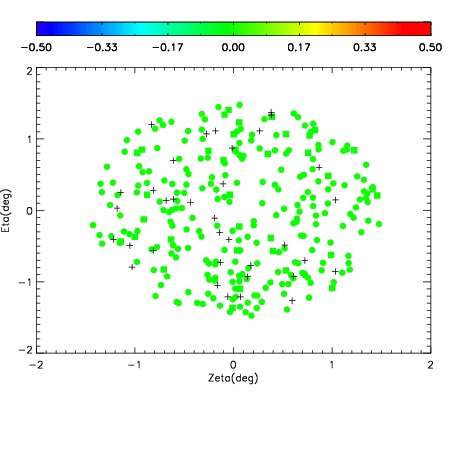
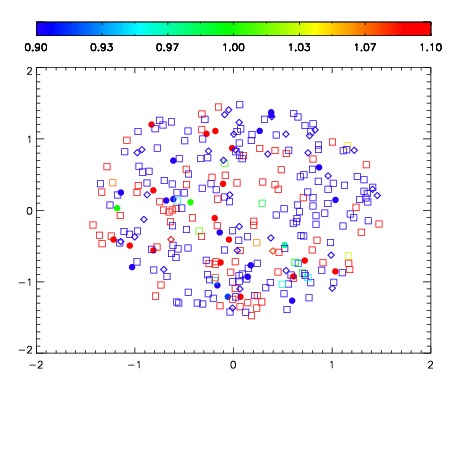


| Frame | Nreads | Zeropoints | Mag plots | Spatial mag deviation | Spatial sky 16325A emission deviations (filled: sky, open: star) | Spatial sky continuum emission | Spatial sky telluric CO2 absorption deviations (filled: H < 10) | |||||||||||||||||||||||
| 0 | 0 |
|
|
|
|
|
|
| IPAIR | NAME | SHIFT | NEWSHIFT | S/N | NAME | SHIFT | NEWSHIFT | S/N |
| 0 | 17330024 | 0.508094 | 0.00000 | 18.7069 | 17330025 | 0.00186511 | 0.506229 | 18.7689 |
| 1 | 17330023 | 0.507136 | 0.000958025 | 18.8255 | 17330022 | 0.00000 | 0.508094 | 18.8350 |
| 2 | 17330028 | 0.506034 | 0.00206000 | 18.6701 | 17330026 | 0.00117385 | 0.506920 | 18.7432 |
| 3 | 17330027 | 0.505810 | 0.00228399 | 18.6552 | 17330029 | 0.00175978 | 0.506334 | 18.6497 |