| Red | Green | Blue | |
| z | 17.64 | ||
| znorm | Inf | ||
| sky | -Inf | -Inf | -Inf |
| S/N | 12.0 | 21.1 | 25.4 |
| S/N(c) | 0.0 | 0.0 | 0.0 |
| SN(E/C) |
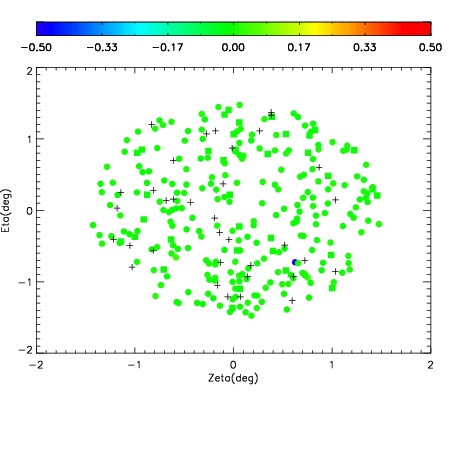
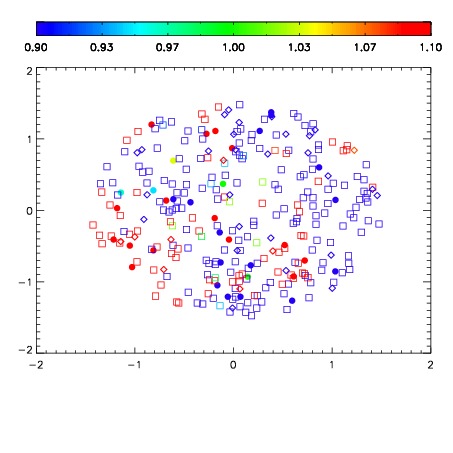
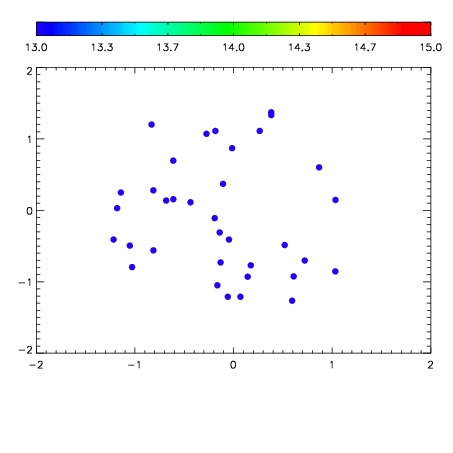

| Frame | Nreads | Zeropoints | Mag plots | Spatial mag deviation | Spatial sky 16325A emission deviations (filled: sky, open: star) | Spatial sky continuum emission | Spatial sky telluric CO2 absorption deviations (filled: H < 10) | |||||||||||||||||||||||
| 0 | 0 |
|
|
|
|
|
|
| IPAIR | NAME | SHIFT | NEWSHIFT | S/N | NAME | SHIFT | NEWSHIFT | S/N |
| 0 | 17590017 | 0.509477 | 0.00000 | 15.8586 | 17590018 | 0.00486901 | 0.504608 | 17.3298 |
| 1 | 17590012 | 0.507199 | 0.00227803 | 18.3612 | 17590011 | 0.00000 | 0.509477 | 18.5342 |
| 2 | 17590013 | 0.507736 | 0.00174099 | 17.9527 | 17590014 | 0.00280897 | 0.506668 | 18.2326 |
| 3 | 17590016 | 0.508455 | 0.00102204 | 17.5112 | 17590015 | 0.00300693 | 0.506470 | 17.3572 |