| Red | Green | Blue | |
| z | 17.64 | ||
| znorm | Inf | ||
| sky | -Inf | -Inf | -Inf |
| S/N | 24.5 | 40.7 | 47.8 |
| S/N(c) | 0.0 | 0.0 | 0.0 |
| SN(E/C) |
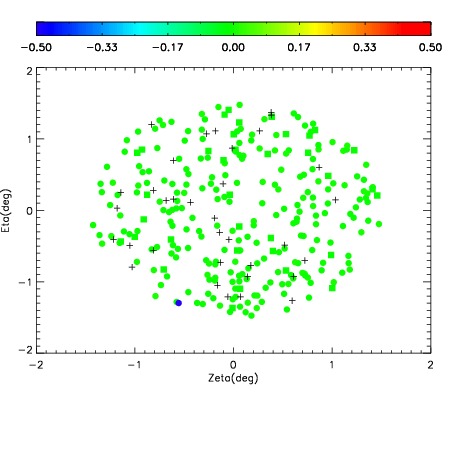
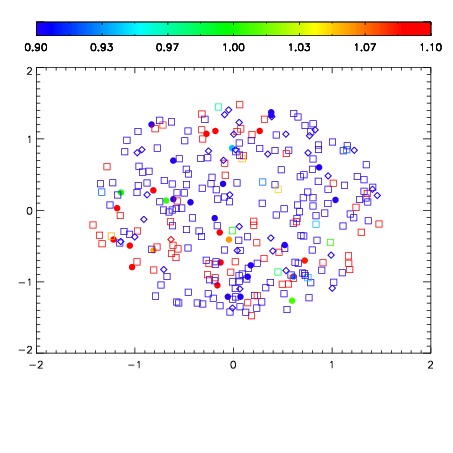


| Frame | Nreads | Zeropoints | Mag plots | Spatial mag deviation | Spatial sky 16325A emission deviations (filled: sky, open: star) | Spatial sky continuum emission | Spatial sky telluric CO2 absorption deviations (filled: H < 10) | |||||||||||||||||||||||
| 0 | 0 |
|
|
|
|
|
|
| IPAIR | NAME | SHIFT | NEWSHIFT | S/N | NAME | SHIFT | NEWSHIFT | S/N |
| 0 | 19680070 | 0.00282999 | 0.00000 | 18.9733 | 19680072 | -0.487994 | 0.490824 | 19.0107 |
| 1 | 19680071 | 0.00260590 | 0.000224090 | 18.9576 | 19680068 | -0.489198 | 0.492028 | 18.8615 |
| 2 | 19680067 | 0.00000 | 0.00282999 | 18.8574 | 19680069 | -0.488932 | 0.491762 | 18.8381 |