| Red | Green | Blue | |
| z | 17.64 | ||
| znorm | Inf | ||
| sky | -Inf | -Inf | -NaN |
| S/N | 28.7 | 48.2 | 51.1 |
| S/N(c) | 0.0 | 0.0 | 0.0 |
| SN(E/C) |
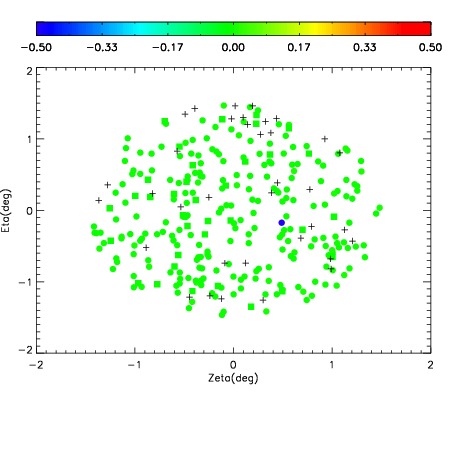
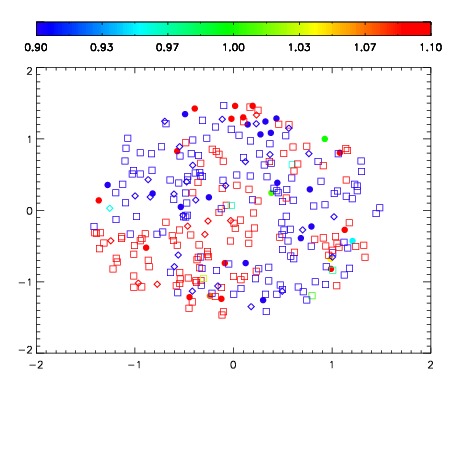


| Frame | Nreads | Zeropoints | Mag plots | Spatial mag deviation | Spatial sky 16325A emission deviations (filled: sky, open: star) | Spatial sky continuum emission | Spatial sky telluric CO2 absorption deviations (filled: H < 10) | |||||||||||||||||||||||
| 0 | 0 |
|
|
|
|
|
|
| IPAIR | NAME | SHIFT | NEWSHIFT | S/N | NAME | SHIFT | NEWSHIFT | S/N |
| 0 | 14290017 | 0.503904 | 0.00000 | 19.1130 | 14290018 | 0.00110604 | 0.502798 | 19.1214 |
| 1 | 14290016 | 0.502715 | 0.00118899 | 19.1515 | 14290015 | -0.000716329 | 0.504620 | 19.1638 |
| 2 | 14290013 | 0.502415 | 0.00148898 | 19.1446 | 14290011 | 0.00000 | 0.503904 | 19.1569 |
| 3 | 14290012 | 0.502295 | 0.00160897 | 19.1275 | 14290014 | -0.000405410 | 0.504309 | 19.1517 |