| Red | Green | Blue | |
| z | 17.64 | ||
| znorm | Inf | ||
| sky | -Inf | -Inf | -Inf |
| S/N | 25.1 | 44.2 | 46.3 |
| S/N(c) | 0.0 | 0.0 | 0.0 |
| SN(E/C) |
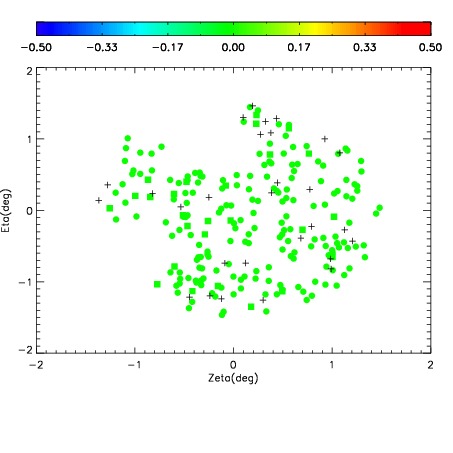
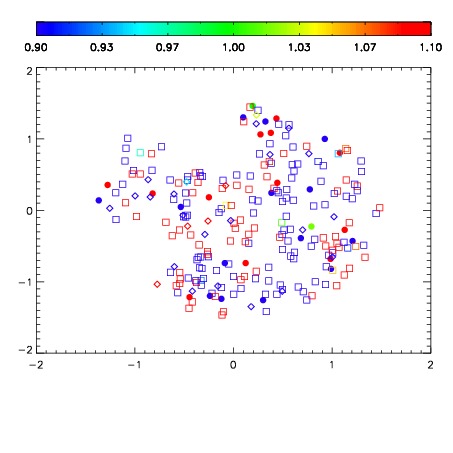
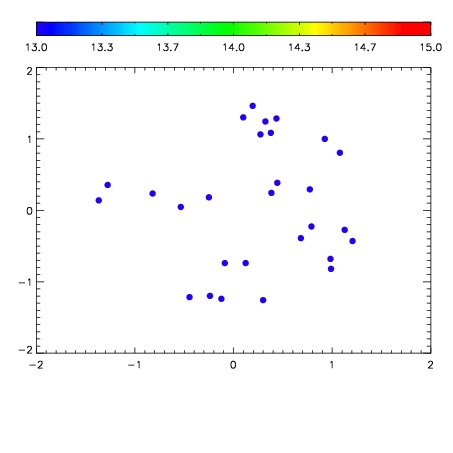

| Frame | Nreads | Zeropoints | Mag plots | Spatial mag deviation | Spatial sky 16325A emission deviations (filled: sky, open: star) | Spatial sky continuum emission | Spatial sky telluric CO2 absorption deviations (filled: H < 10) | |||||||||||||||||||||||
| 0 | 0 |
|
|
|
|
|
|
| IPAIR | NAME | SHIFT | NEWSHIFT | S/N | NAME | SHIFT | NEWSHIFT | S/N |
| 0 | 16430072 | 0.487981 | 0.00000 | 18.9939 | 16430066 | 0.00000 | 0.487981 | 18.9374 |
| 1 | 16430068 | 0.487697 | 0.000283986 | 19.0153 | 16430070 | 0.000297438 | 0.487684 | 18.9806 |
| 2 | 16430071 | 0.487430 | 0.000550985 | 18.9841 | 16430069 | 0.000380931 | 0.487600 | 18.9085 |
| 3 | 16430067 | 0.487373 | 0.000607997 | 18.9200 | 16430073 | 0.00173896 | 0.486242 | 18.8667 |