| Red | Green | Blue | |
| z | 17.64 | ||
| znorm | Inf | ||
| sky | -Inf | -Inf | -NaN |
| S/N | 20.0 | 35.8 | 38.9 |
| S/N(c) | 0.0 | 0.0 | 0.0 |
| SN(E/C) |
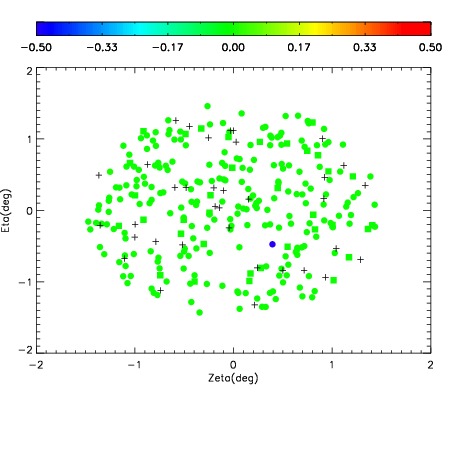
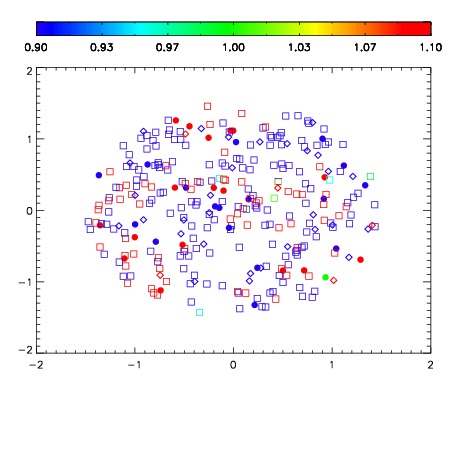
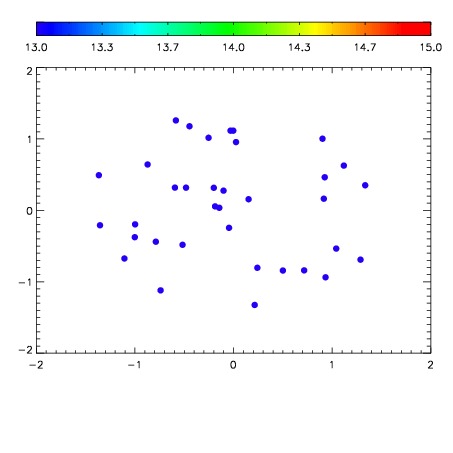

| Frame | Nreads | Zeropoints | Mag plots | Spatial mag deviation | Spatial sky 16325A emission deviations (filled: sky, open: star) | Spatial sky continuum emission | Spatial sky telluric CO2 absorption deviations (filled: H < 10) | |||||||||||||||||||||||
| 0 | 0 |
|
|
|
|
|
|
| IPAIR | NAME | SHIFT | NEWSHIFT | S/N | NAME | SHIFT | NEWSHIFT | S/N |
| 0 | 14600031 | 0.497877 | 0.00000 | 18.5137 | 14600032 | -0.000804977 | 0.498682 | 18.6514 |
| 1 | 14600030 | 0.497080 | 0.000797004 | 18.8013 | 14600025 | 0.00000 | 0.497877 | 18.7170 |
| 2 | 14600027 | 0.496218 | 0.00165901 | 18.5123 | 14600029 | -0.000739266 | 0.498616 | 18.6189 |
| 3 | 14600026 | 0.495921 | 0.00195602 | 18.4870 | 14600028 | -0.000688624 | 0.498566 | 18.3147 |