| Red | Green | Blue | |
| z | 17.64 | ||
| znorm | Inf | ||
| sky | -Inf | -Inf | -NaN |
| S/N | 19.2 | 34.9 | 37.2 |
| S/N(c) | 0.0 | 0.0 | 0.0 |
| SN(E/C) |

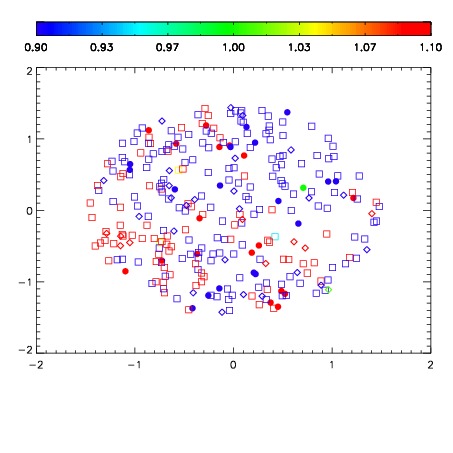


| Frame | Nreads | Zeropoints | Mag plots | Spatial mag deviation | Spatial sky 16325A emission deviations (filled: sky, open: star) | Spatial sky continuum emission | Spatial sky telluric CO2 absorption deviations (filled: H < 10) | |||||||||||||||||||||||
| 0 | 0 |
|
|
|
|
|
|
| IPAIR | NAME | SHIFT | NEWSHIFT | S/N | NAME | SHIFT | NEWSHIFT | S/N |
| 0 | 14960032 | 0.503820 | 0.00000 | 17.4002 | 14960033 | 0.00340889 | 0.500411 | 17.8968 |
| 1 | 14960028 | 0.501578 | 0.00224203 | 19.0598 | 14960029 | 0.00194516 | 0.501875 | 19.0573 |
| 2 | 14960027 | 0.500417 | 0.00340301 | 19.0471 | 14960026 | 0.00000 | 0.503820 | 18.9711 |
| 3 | 14960031 | 0.503143 | 0.000676990 | 17.9556 | 14960030 | 0.00256857 | 0.501251 | 18.3656 |