| Red | Green | Blue | |
| z | 17.64 | ||
| znorm | Inf | ||
| sky | -Inf | -Inf | -NaN |
| S/N | 27.8 | 48.7 | 55.9 |
| S/N(c) | 0.0 | 0.0 | 0.0 |
| SN(E/C) |
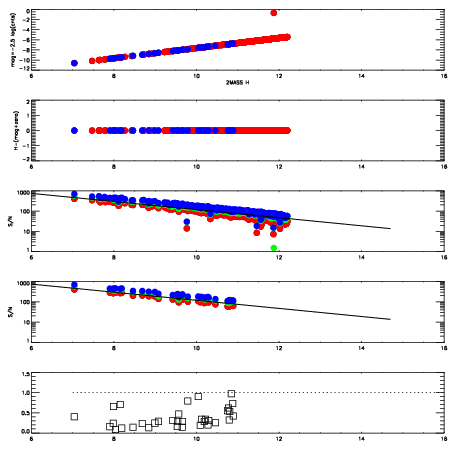
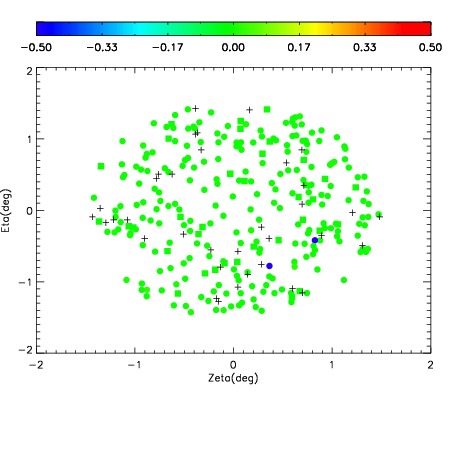
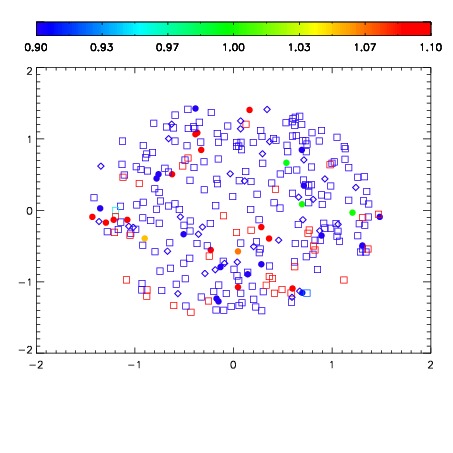


| Frame | Nreads | Zeropoints | Mag plots | Spatial mag deviation | Spatial sky 16325A emission deviations (filled: sky, open: star) | Spatial sky continuum emission | Spatial sky telluric CO2 absorption deviations (filled: H < 10) | |||||||||||||||||||||||
| 0 | 0 |
|
|
|
|
|
|
| IPAIR | NAME | SHIFT | NEWSHIFT | S/N | NAME | SHIFT | NEWSHIFT | S/N |
| 0 | 17350065 | 0.502644 | 0.00000 | 19.1883 | 17350070 | 0.00171926 | 0.500925 | 19.2269 |
| 1 | 17350068 | 0.501035 | 0.00160903 | 19.1721 | 17350066 | 0.00158770 | 0.501056 | 19.1948 |
| 2 | 17350069 | 0.501868 | 0.000775993 | 19.1472 | 17350067 | 0.00122020 | 0.501424 | 19.1919 |
| 3 | 17350064 | 0.502194 | 0.000450015 | 19.1122 | 17350063 | 0.00000 | 0.502644 | 19.0833 |