| Red | Green | Blue | |
| z | 17.64 | ||
| znorm | Inf | ||
| sky | -Inf | -Inf | -NaN |
| S/N | 29.1 | 49.8 | 52.7 |
| S/N(c) | 0.0 | 0.0 | 0.0 |
| SN(E/C) |


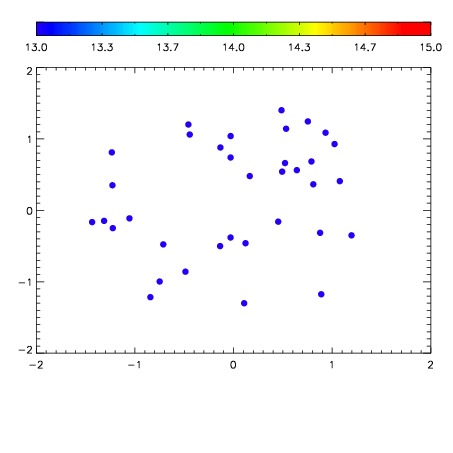

| Frame | Nreads | Zeropoints | Mag plots | Spatial mag deviation | Spatial sky 16325A emission deviations (filled: sky, open: star) | Spatial sky continuum emission | Spatial sky telluric CO2 absorption deviations (filled: H < 10) | |||||||||||||||||||||||
| 0 | 0 |
|
|
|
|
|
|
| IPAIR | NAME | SHIFT | NEWSHIFT | S/N | NAME | SHIFT | NEWSHIFT | S/N |
| 0 | 14880012 | 0.490695 | 0.00000 | 18.9660 | 14880011 | 0.00000 | 0.490695 | 18.8599 |
| 1 | 14880017 | 0.486238 | 0.00445700 | 19.1718 | 14880018 | -0.00395411 | 0.494649 | 19.1908 |
| 2 | 14880016 | 0.487539 | 0.00315601 | 19.1491 | 14880015 | -0.00349263 | 0.494188 | 19.1402 |
| 3 | 14880013 | 0.489824 | 0.000871003 | 19.0516 | 14880014 | -0.00331769 | 0.494013 | 19.1340 |