| Red | Green | Blue | |
| z | 17.64 | ||
| znorm | Inf | ||
| sky | -Inf | -NaN | -Inf |
| S/N | 32.3 | 53.4 | 58.9 |
| S/N(c) | 0.0 | 0.0 | 0.0 |
| SN(E/C) |


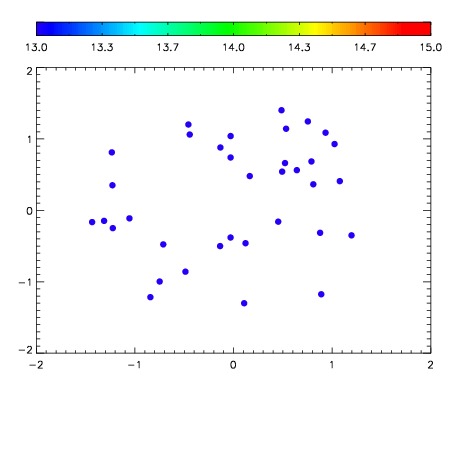

| Frame | Nreads | Zeropoints | Mag plots | Spatial mag deviation | Spatial sky 16325A emission deviations (filled: sky, open: star) | Spatial sky continuum emission | Spatial sky telluric CO2 absorption deviations (filled: H < 10) | |||||||||||||||||||||||
| 0 | 0 |
|
|
|
|
|
|
| IPAIR | NAME | SHIFT | NEWSHIFT | S/N | NAME | SHIFT | NEWSHIFT | S/N |
| 0 | 14980013 | 0.490710 | 0.00000 | 19.2095 | 14980015 | -0.00210243 | 0.492812 | 19.2195 |
| 1 | 14980012 | 0.490643 | 6.69956e-05 | 19.2356 | 14980014 | -0.00193441 | 0.492644 | 19.2346 |
| 2 | 14980017 | 0.487147 | 0.00356299 | 19.1890 | 14980018 | -0.00372822 | 0.494438 | 19.1607 |
| 3 | 14980016 | 0.488908 | 0.00180200 | 19.1359 | 14980011 | 0.00000 | 0.490710 | 19.0577 |