| Red | Green | Blue | |
| z | 17.64 | ||
| znorm | Inf | ||
| sky | -Inf | -Inf | -Inf |
| S/N | 16.9 | 29.1 | 33.0 |
| S/N(c) | 0.0 | 0.0 | 0.0 |
| SN(E/C) |

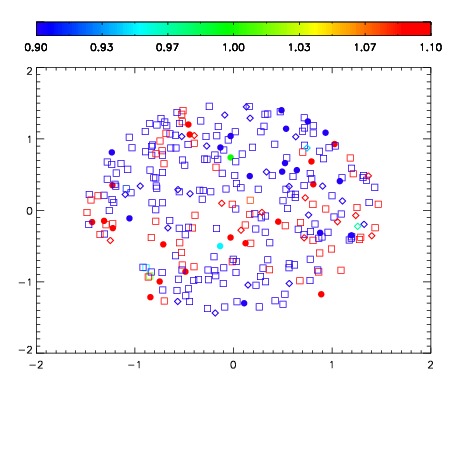


| Frame | Nreads | Zeropoints | Mag plots | Spatial mag deviation | Spatial sky 16325A emission deviations (filled: sky, open: star) | Spatial sky continuum emission | Spatial sky telluric CO2 absorption deviations (filled: H < 10) | |||||||||||||||||||||||
| 0 | 0 |
|
|
|
|
|
|
| IPAIR | NAME | SHIFT | NEWSHIFT | S/N | NAME | SHIFT | NEWSHIFT | S/N |
| 0 | 15210017 | 0.507471 | 0.00000 | 18.3575 | 15210018 | 0.00112295 | 0.506348 | 18.2027 |
| 1 | 15210013 | 0.506105 | 0.00136602 | 18.8093 | 15210011 | 0.00000 | 0.507471 | 18.4772 |
| 2 | 15210012 | 0.505406 | 0.00206500 | 18.7912 | 15210014 | -0.000882942 | 0.508354 | 18.2810 |
| 3 | 15210016 | 0.506863 | 0.000608027 | 18.3294 | 15210015 | -0.000394298 | 0.507865 | 18.0953 |