| Red | Green | Blue | |
| z | 17.64 | ||
| znorm | Inf | ||
| sky | -Inf | -Inf | -Inf |
| S/N | 24.1 | 42.1 | 46.0 |
| S/N(c) | 0.0 | 0.0 | 0.0 |
| SN(E/C) |
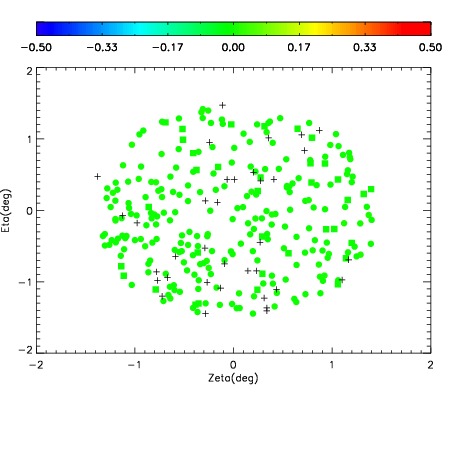
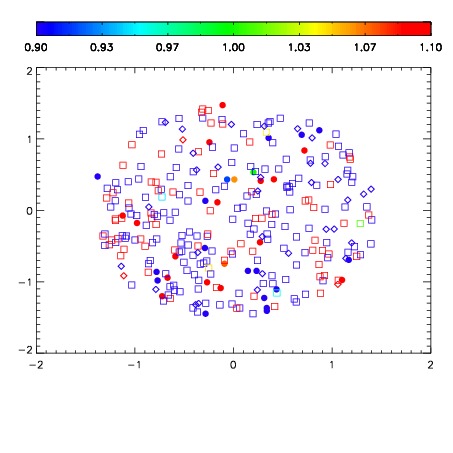


| Frame | Nreads | Zeropoints | Mag plots | Spatial mag deviation | Spatial sky 16325A emission deviations (filled: sky, open: star) | Spatial sky continuum emission | Spatial sky telluric CO2 absorption deviations (filled: H < 10) | |||||||||||||||||||||||
| 0 | 0 |
|
|
|
|
|
|
| IPAIR | NAME | SHIFT | NEWSHIFT | S/N | NAME | SHIFT | NEWSHIFT | S/N |
| 0 | 14090087 | 0.500019 | 0.00000 | 18.7917 | 14090088 | 0.00131500 | 0.498704 | 18.7865 |
| 1 | 14090083 | 0.497935 | 0.00208402 | 19.0486 | 14090084 | -0.00107775 | 0.501097 | 19.1373 |
| 2 | 14090082 | 0.496897 | 0.00312200 | 19.0299 | 14090085 | -0.000403689 | 0.500423 | 19.0655 |
| 3 | 14090086 | 0.498578 | 0.00144100 | 18.9628 | 14090081 | 0.00000 | 0.500019 | 18.8522 |