| Red | Green | Blue | |
| z | 17.64 | ||
| znorm | Inf | ||
| sky | -Inf | -Inf | -NaN |
| S/N | 18.4 | 33.1 | 35.9 |
| S/N(c) | 0.0 | 0.0 | 0.0 |
| SN(E/C) |
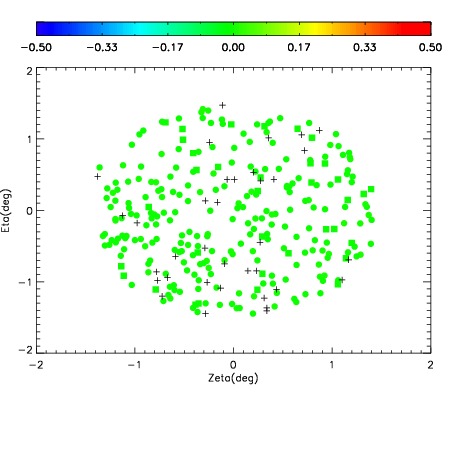
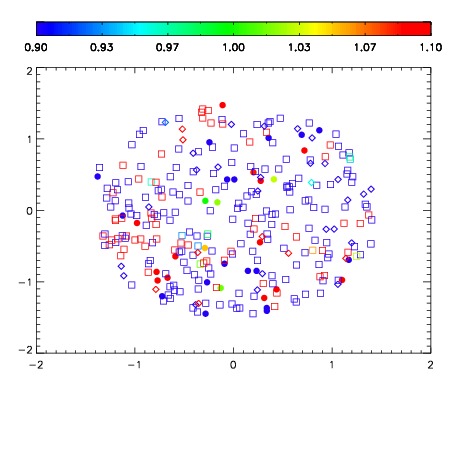


| Frame | Nreads | Zeropoints | Mag plots | Spatial mag deviation | Spatial sky 16325A emission deviations (filled: sky, open: star) | Spatial sky continuum emission | Spatial sky telluric CO2 absorption deviations (filled: H < 10) | |||||||||||||||||||||||
| 0 | 0 |
|
|
|
|
|
|
| IPAIR | NAME | SHIFT | NEWSHIFT | S/N | NAME | SHIFT | NEWSHIFT | S/N |
| 0 | 14420035 | 0.498858 | 0.00000 | 17.8789 | 14420036 | -0.000603520 | 0.499462 | 18.3163 |
| 1 | 14420038 | 0.496261 | 0.00259700 | 18.8497 | 14420037 | -0.00148011 | 0.500338 | 18.9529 |
| 2 | 14420039 | 0.497157 | 0.00170100 | 18.7000 | 14420040 | -0.00117529 | 0.500033 | 18.8807 |
| 3 | 14420034 | 0.498687 | 0.000171006 | 17.8469 | 14420033 | 0.00000 | 0.498858 | 18.1743 |