| Red | Green | Blue | |
| z | 17.64 | ||
| znorm | Inf | ||
| sky | -Inf | -Inf | -NaN |
| S/N | 22.7 | 41.2 | 45.5 |
| S/N(c) | 0.0 | 0.0 | 0.0 |
| SN(E/C) |


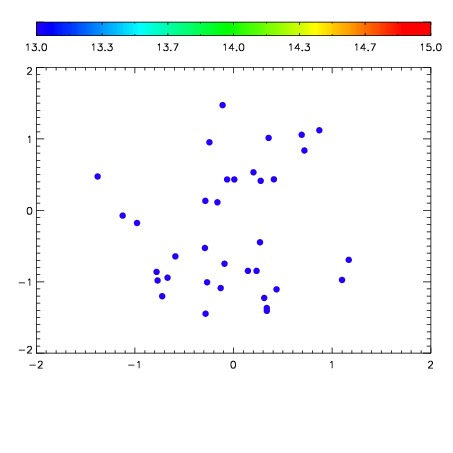

| Frame | Nreads | Zeropoints | Mag plots | Spatial mag deviation | Spatial sky 16325A emission deviations (filled: sky, open: star) | Spatial sky continuum emission | Spatial sky telluric CO2 absorption deviations (filled: H < 10) | |||||||||||||||||||||||
| 0 | 0 |
|
|
|
|
|
|
| IPAIR | NAME | SHIFT | NEWSHIFT | S/N | NAME | SHIFT | NEWSHIFT | S/N |
| 0 | 14870037 | 0.492672 | 0.00000 | 18.6484 | 14870035 | 0.00000 | 0.492672 | 18.4574 |
| 1 | 14870040 | 0.489179 | 0.00349301 | 19.0649 | 14870042 | -0.00413467 | 0.496807 | 19.0484 |
| 2 | 14870041 | 0.489739 | 0.00293300 | 19.0352 | 14870039 | -0.00221708 | 0.494889 | 19.0383 |
| 3 | 14870036 | 0.492333 | 0.000339001 | 18.6558 | 14870038 | -0.00208241 | 0.494754 | 19.0236 |