| Red | Green | Blue | |
| z | 17.64 | ||
| znorm | Inf | ||
| sky | -NaN | -NaN | -Inf |
| S/N | 28.0 | 47.9 | 53.1 |
| S/N(c) | 0.0 | 0.0 | 0.0 |
| SN(E/C) |
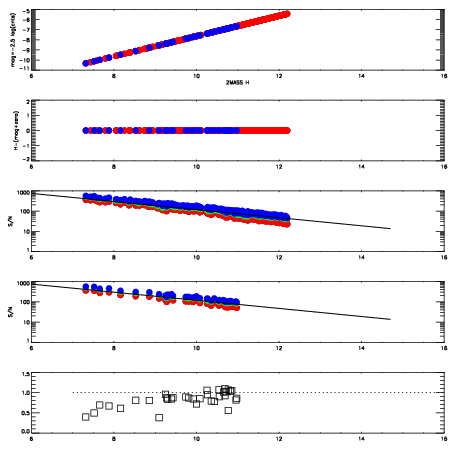
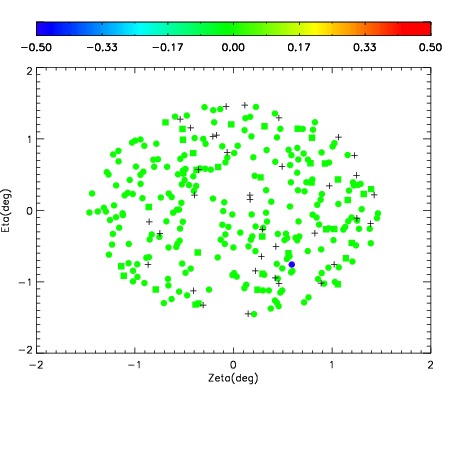


| Frame | Nreads | Zeropoints | Mag plots | Spatial mag deviation | Spatial sky 16325A emission deviations (filled: sky, open: star) | Spatial sky continuum emission | Spatial sky telluric CO2 absorption deviations (filled: H < 10) | |||||||||||||||||||||||
| 0 | 0 |
|
|
|
|
|
|
| IPAIR | NAME | SHIFT | NEWSHIFT | S/N | NAME | SHIFT | NEWSHIFT | S/N |
| 0 | 14950026 | 0.498159 | 0.00000 | 19.0874 | 14950024 | 0.00000 | 0.498159 | 19.0614 |
| 1 | 14950030 | 0.495262 | 0.00289699 | 19.0921 | 14950031 | -0.00230711 | 0.500466 | 19.0900 |
| 2 | 14950029 | 0.495442 | 0.00271699 | 19.0778 | 14950027 | -0.00128165 | 0.499441 | 19.0331 |
| 3 | 14950025 | 0.497015 | 0.00114399 | 19.0267 | 14950028 | -0.00108160 | 0.499241 | 19.0196 |