| Red | Green | Blue | |
| z | 17.64 | ||
| znorm | Inf | ||
| sky | -NaN | -NaN | -Inf |
| S/N | 26.4 | 44.1 | 51.2 |
| S/N(c) | 0.0 | 0.0 | 0.0 |
| SN(E/C) |
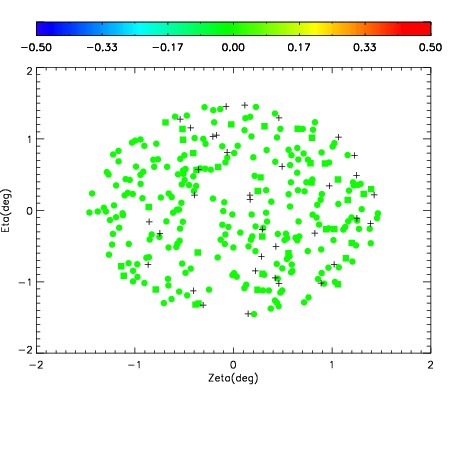
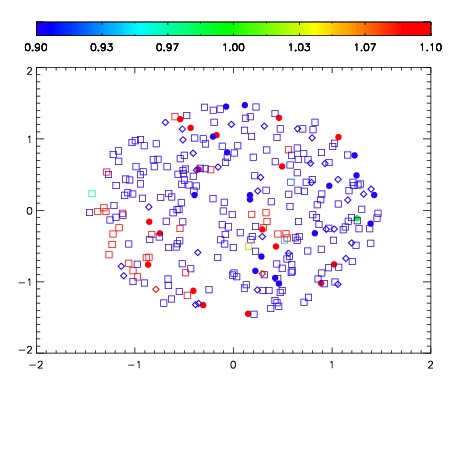
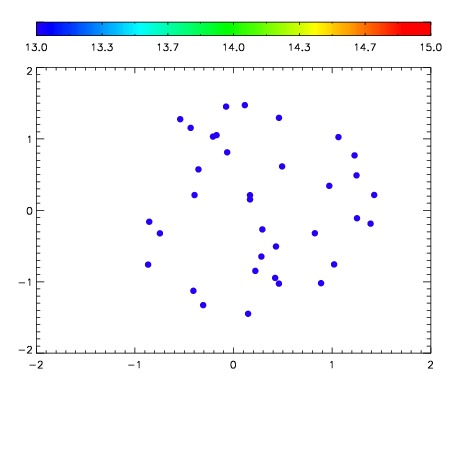

| Frame | Nreads | Zeropoints | Mag plots | Spatial mag deviation | Spatial sky 16325A emission deviations (filled: sky, open: star) | Spatial sky continuum emission | Spatial sky telluric CO2 absorption deviations (filled: H < 10) | |||||||||||||||||||||||
| 0 | 0 |
|
|
|
|
|
|
| IPAIR | NAME | SHIFT | NEWSHIFT | S/N | NAME | SHIFT | NEWSHIFT | S/N |
| 0 | 17320094 | 0.00204522 | 0.00000 | 19.2026 | 17320095 | -0.501389 | 0.503434 | 19.1607 |
| 1 | 17320090 | 0.00000 | 0.00204522 | 19.2161 | 17320091 | -0.503034 | 0.505079 | 19.2621 |
| 2 | 17320093 | 0.00136855 | 0.000676670 | 19.2032 | 17320092 | -0.502640 | 0.504685 | 19.1804 |