| Red | Green | Blue | |
| z | 17.64 | ||
| znorm | Inf | ||
| sky | -Inf | -Inf | -Inf |
| S/N | 26.8 | 47.2 | 51.8 |
| S/N(c) | 0.0 | 0.0 | 0.0 |
| SN(E/C) |
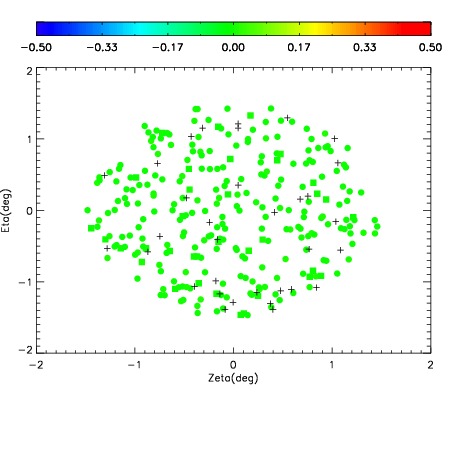
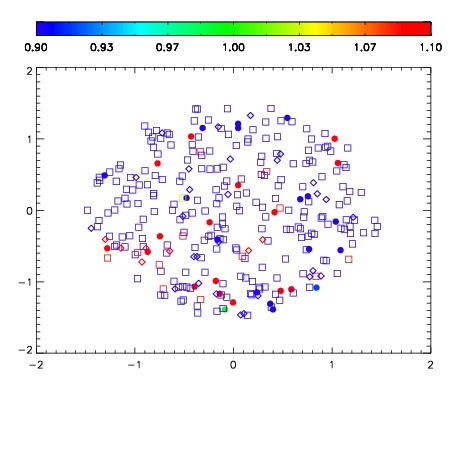
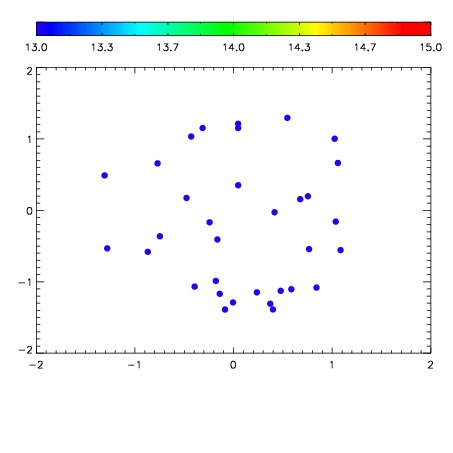

| Frame | Nreads | Zeropoints | Mag plots | Spatial mag deviation | Spatial sky 16325A emission deviations (filled: sky, open: star) | Spatial sky continuum emission | Spatial sky telluric CO2 absorption deviations (filled: H < 10) | |||||||||||||||||||||||
| 0 | 0 |
|
|
|
|
|
|
| IPAIR | NAME | SHIFT | NEWSHIFT | S/N | NAME | SHIFT | NEWSHIFT | S/N |
| 0 | 13740100 | 0.490111 | 0.00000 | 18.9804 | 13740101 | -0.00103160 | 0.491143 | 18.9530 |
| 1 | 13740096 | 0.479522 | 0.0105890 | 19.0886 | 13740097 | -0.00146867 | 0.491580 | 19.1090 |
| 2 | 13740095 | 0.480988 | 0.00912300 | 19.0689 | 13740098 | -0.000617824 | 0.490729 | 19.0451 |
| 3 | 13740099 | 0.487200 | 0.00291100 | 19.0551 | 13740094 | 0.00000 | 0.490111 | 19.0306 |