| Red | Green | Blue | |
| z | 17.64 | ||
| znorm | Inf | ||
| sky | -Inf | -Inf | -NaN |
| S/N | 22.9 | 41.5 | 44.1 |
| S/N(c) | 0.0 | 0.0 | 0.0 |
| SN(E/C) |
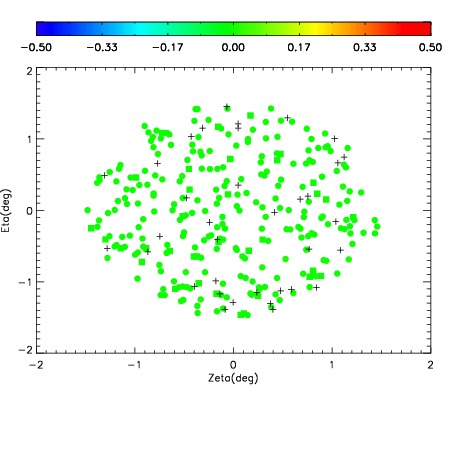
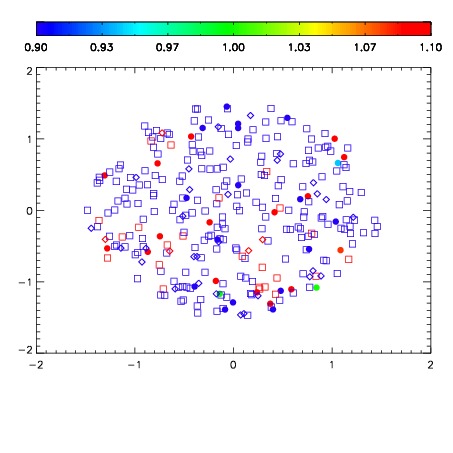
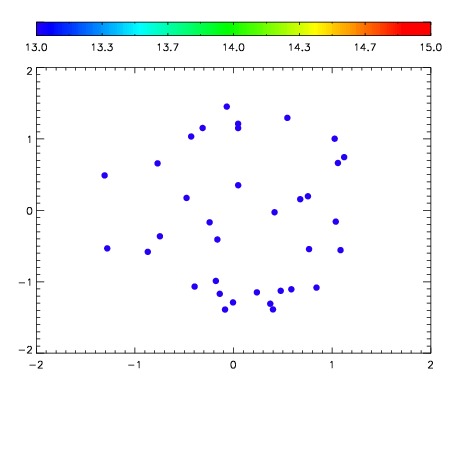

| Frame | Nreads | Zeropoints | Mag plots | Spatial mag deviation | Spatial sky 16325A emission deviations (filled: sky, open: star) | Spatial sky continuum emission | Spatial sky telluric CO2 absorption deviations (filled: H < 10) | |||||||||||||||||||||||
| 0 | 0 |
|
|
|
|
|
|
| IPAIR | NAME | SHIFT | NEWSHIFT | S/N | NAME | SHIFT | NEWSHIFT | S/N |
| 0 | 13810064 | 0.493098 | 0.00000 | 18.9406 | 13810065 | -0.00383287 | 0.496931 | 18.9678 |
| 1 | 13810063 | 0.490758 | 0.00233999 | 18.9364 | 13810069 | -0.00599870 | 0.499097 | 18.9434 |
| 2 | 13810068 | 0.488969 | 0.00412899 | 18.8702 | 13810062 | 0.00000 | 0.493098 | 18.9123 |
| 3 | 13810067 | 0.490574 | 0.00252399 | 18.8209 | 13810066 | -0.00379750 | 0.496895 | 18.8174 |