| Red | Green | Blue | |
| z | 17.64 | ||
| znorm | Inf | ||
| sky | -Inf | -Inf | -Inf |
| S/N | 25.7 | 44.9 | 47.5 |
| S/N(c) | 0.0 | 0.0 | 0.0 |
| SN(E/C) |
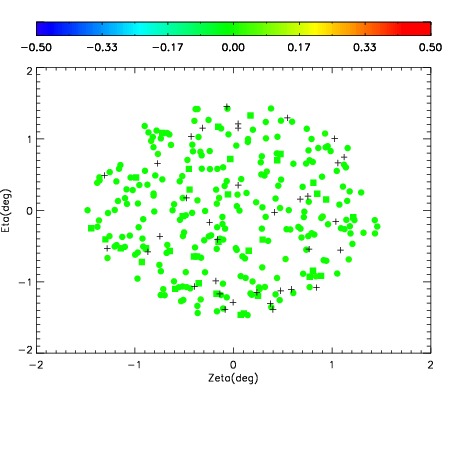
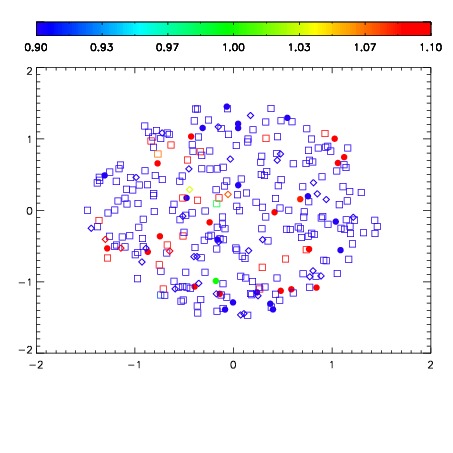


| Frame | Nreads | Zeropoints | Mag plots | Spatial mag deviation | Spatial sky 16325A emission deviations (filled: sky, open: star) | Spatial sky continuum emission | Spatial sky telluric CO2 absorption deviations (filled: H < 10) | |||||||||||||||||||||||
| 0 | 0 |
|
|
|
|
|
|
| IPAIR | NAME | SHIFT | NEWSHIFT | S/N | NAME | SHIFT | NEWSHIFT | S/N |
| 0 | 14090061 | 0.495264 | 0.00000 | 18.7749 | 14090062 | -0.000894196 | 0.496158 | 18.6256 |
| 1 | 14090060 | 0.490928 | 0.00433600 | 19.0615 | 14090059 | 0.00000 | 0.495264 | 19.0762 |
| 2 | 14090065 | 0.491246 | 0.00401798 | 19.0535 | 14090066 | -0.00268988 | 0.497954 | 19.0722 |
| 3 | 14090064 | 0.491532 | 0.00373200 | 18.9959 | 14090063 | -0.00160853 | 0.496873 | 18.9992 |